Views: 411
Splunk Search Processing Language comprises of multiple functions, operators and commands that are used together to form a simple to complex search and get the desired results from the ingested logs.
Main components of SPL
Search Field Operators
Comparison Operators
These operators are used to compare the values against the fields.
| Field Name | Operator | Example | Explanation |
|---|---|---|---|
| Equal | = | UserName=Mark | This operator is used to match values against the field. In this example, it will look for all the events, where the value of the field UserName is equal to Mark. |
| Not Equal to | != | UserName!=Mark | This operator returns all the events where the UserName value does not match Mark. |
| Less than | < | Age < 10 | Showing all the events with the value of Age less than 10. |
| Less than or Equal to | <= | Age <= 10 | Showing all the events with the value of Age less than or equal to 10. |
| Greater than | > | Outbound_traffic > 50 MB | This will return all the events where the Outbound traffic value is over 50 MB. |
| Greater Than or Equal to | >= | Outbound_traffic >= 50 MB | This will return all the events where the Outbound traffic value is greater or equal to 50 MB. |
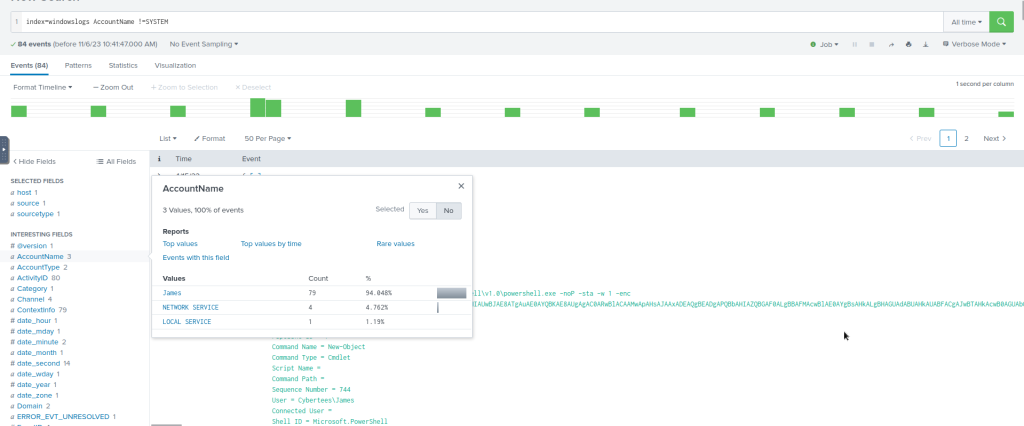
Lets use the comparison operator to display all the event logs from the index “windowslogs”, where AccountName is not Equal to “System”
Boolean Operators
| Operator | Syntax | Explanation |
|---|---|---|
| NOT | field_A NOT value | Ignore the events from the result where field_A contain the specified value. |
| OR | field_A=value1 OR field_A=value2 | Return all the events in which field_A contains either value1 or value2. |
| AND | field_A=value1 AND field_B=value2 | Return all the events in which field_A contains value1 and field_B contains value2. |
#Example Search Query

index=windowslogs AccountName !=SYSTEM AND AccountName=James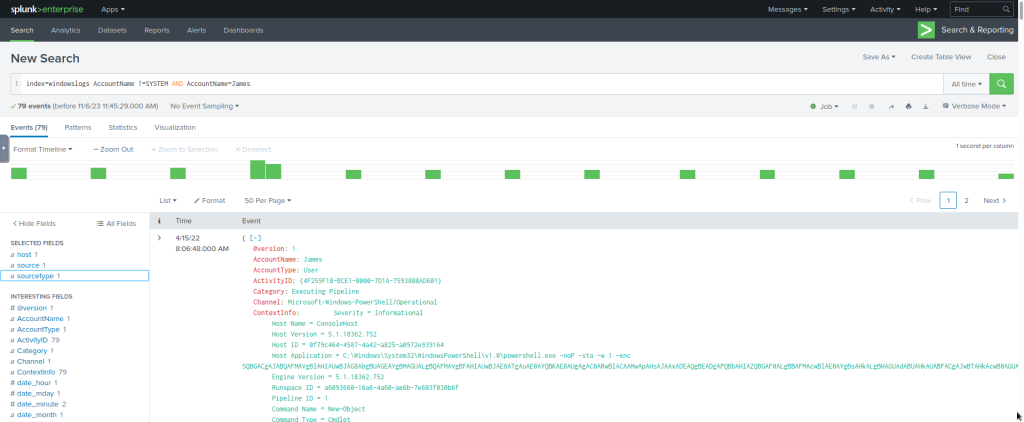
Wild Card
| Wildcard symbol | Example | Explanation |
|---|---|---|
| * | status=fail* | It will return all the results with values likestatus=failedstatus=failure |
#Example Search Query
index=windowslogs DestinationIp=172.*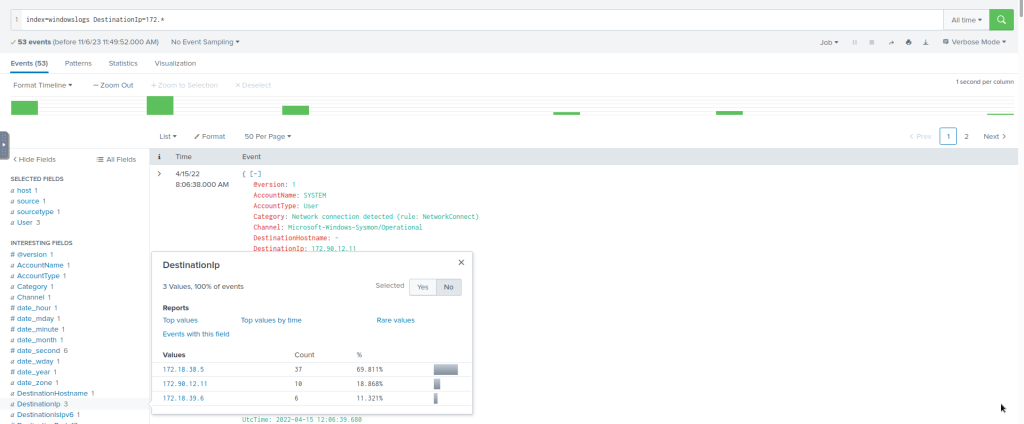
#Some additional Search Queries

index=windowslogs EventID="1" User="Cybertees\\James"

index=windowslogs DestinationIp=172.18.39.6 DestinationPort=135

index=windowslogs  Hostname="Salena.Adam" DestinationIp="172.18.38.5"
Filtering the results in SPL
SPL allows us to use Filters to narrow down the result and only show the important events that we are interested in. We can add or remove certain data from the result using filters.
Fields
| Command | Fields |
|---|---|
| Explanation | Fields command is used to add or remove mentioned fields from the search results. To remove the field, minus sign ( – ) is used before the fieldname and plus ( + ) is used before the fields which we want to display. |
| Syntax | | fields <field_name1> <field_name2> |
| Example | | fields + HostName - EventID |
#Example Query
index=windowslogs | fields + host + User + SourceIp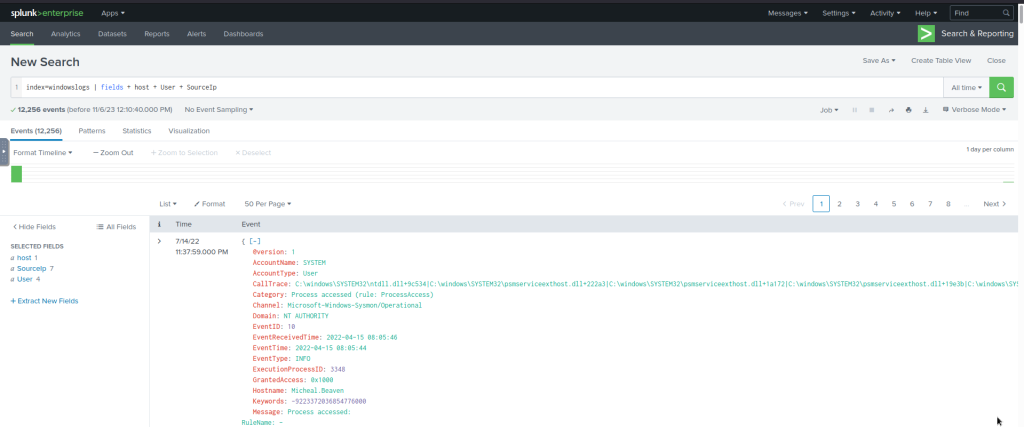
Search
| Command | Search |
|---|---|
| Explanation | This command is used to search for the raw text while using the chaining command | |
| Syntax | | search <search_keyword> |
| Example | | search "Powershell" |
#Example Query

index=windowslogs | search Powershell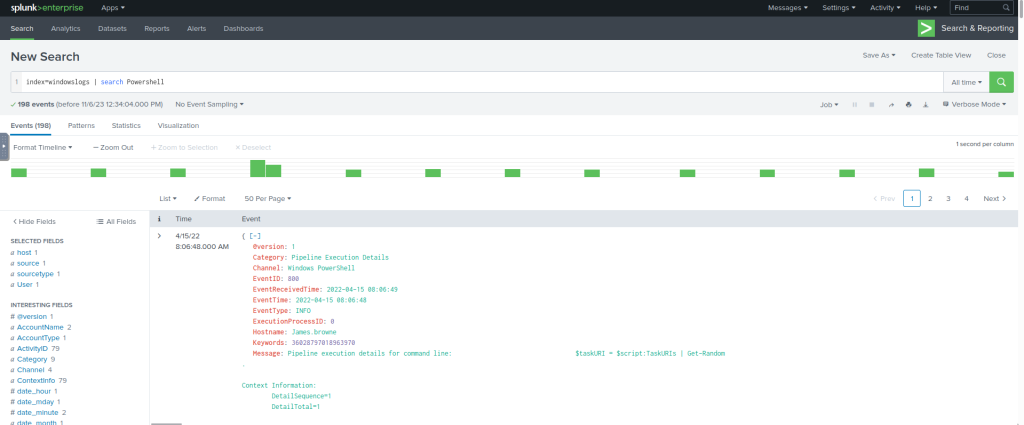
Dedup
| Command | Dedup |
|---|---|
| Explanation | Dedup is the command used to remove duplicate fields from the search results. We often get the results with various fields getting the same results. These commands remove the duplicates to show the unique values. |
| Syntax | | dedup <fieldname> |
| Example | | dedup EventID |
We can use the dedup command to show the list of unique EventIDs from a particular hostname.
#Example Search Query

index=windowslogs | table EventID User Image Hostname | dedup EventID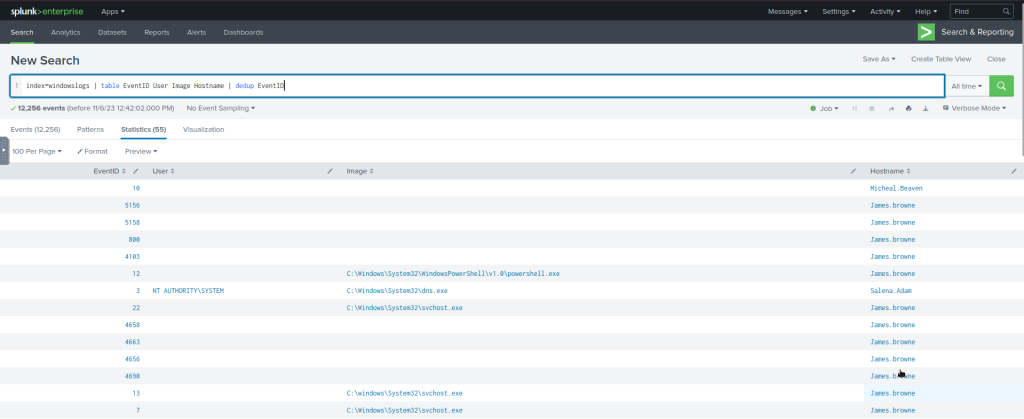
Rename
| Command | rename |
|---|---|
| Explanation | It allows us to change the name of the field in the search results. It is useful in a scenario when the field name is generic or log, or it needs to be updated in the output. |
| Syntax | | rename <fieldname> |
| Example | | rename User as Employees |
#Example Query

index=windowslogs | fields + host + User + SourceIp | rename User as Employees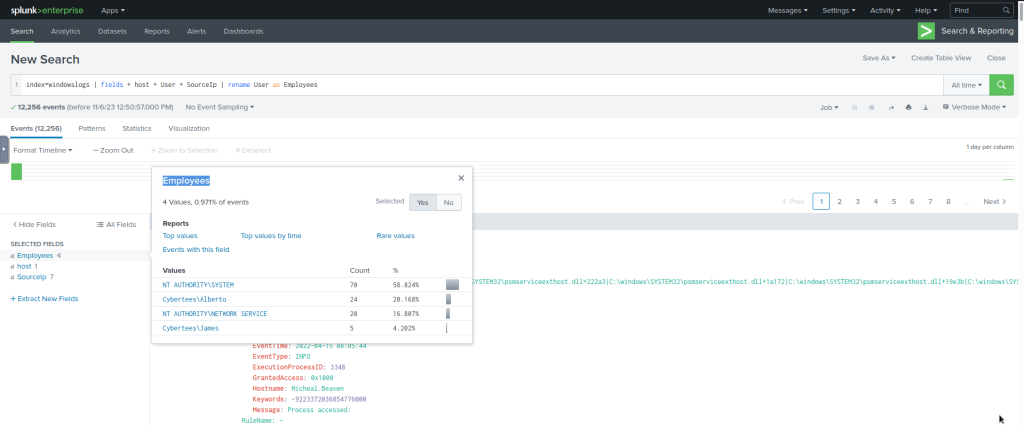
#Additional Search Queries

index=windowslogs | table _time EventID Hostname SourceName | reverse 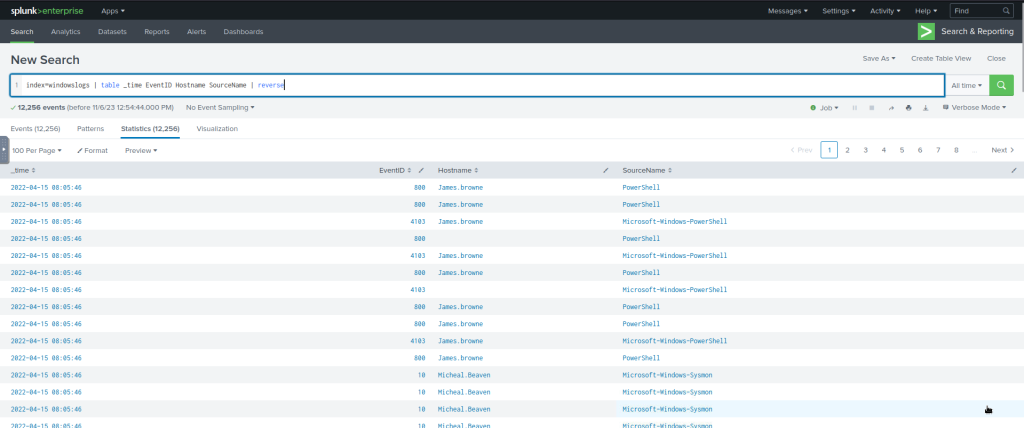
#Example Query

index=windowslogs | table _time EventID Hostname SourceName | reverse
| dedup Hostname
Structuring the Search Results
SPL provides various commands to bring structure or order to the search results. These sorting commands like head, tail, and sort can be very useful during logs investigation.
Table
| Command | table |
|---|---|
| Explanation | Each event has multiple fields, and not every field is important to display. The Table command allows us to create a table with selective fields as columns. |
| Syntax | | table <field_name1> <fieldname_2> |
| Example | | table| head 20 # will return the top 20 events from the result list. |
This search query will create a table with three columns selected and ignore all the remaining columns from the display.
#Example Search Query

index=windowslogs | table EventID Hostname SourceName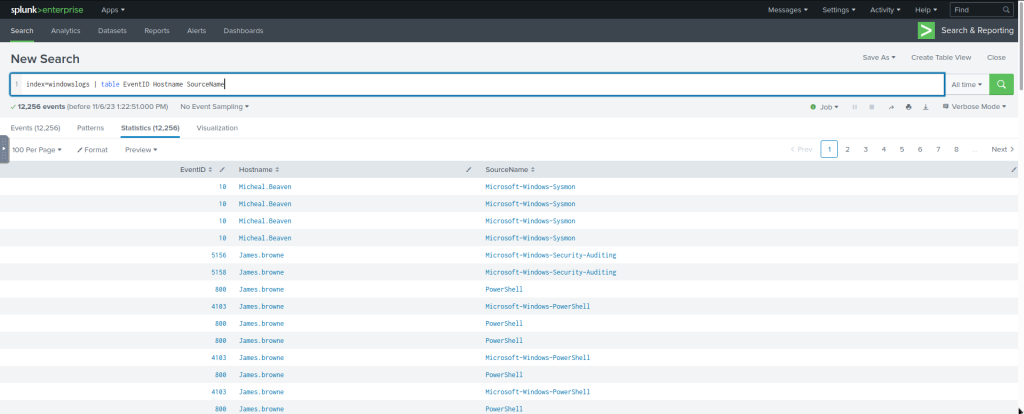
Head
| Command | head |
|---|---|
| Explanation | The head command returns the first 10 events if no number is specified. |
| Syntax | | head <number> |
| Example | | head # will return the top 10 events from the result list| head 20 # will return the top 20 events from the result list |
The following search query will show the table containing the mentioned fields and display only the top 5 entries.
index=windowslogs | table _time EventID Hostname SourceName | head 5
Tail
| Command | tail |
|---|---|
| Explanation | The Tail command returns the last 10 events if no number is specified. |
| Syntax | | tail <number> |
| Example | | tail # will return the last 10 events from the result list| tail 20 # will return the last 20 events from the result list |
The following search query will show the table containing the mentioned fields and display only 5 entries from the bottom of the list.
#Example Search Query

index=windowslogs |  table _time EventID Hostname SourceName | tail 5
Sort
| Command | sort |
|---|---|
| Explanation | The Sort command allows us to order the fields in ascending or descending order. |
| Syntax | | sort <field_name> |
| Example | | sort Hostname # This will sort the result in Ascending order. |
The following search query will sort the results based on the Hostname field.
#Example Search Query

index=windowslogs |  table _time EventID Hostname SourceName | sort Hostname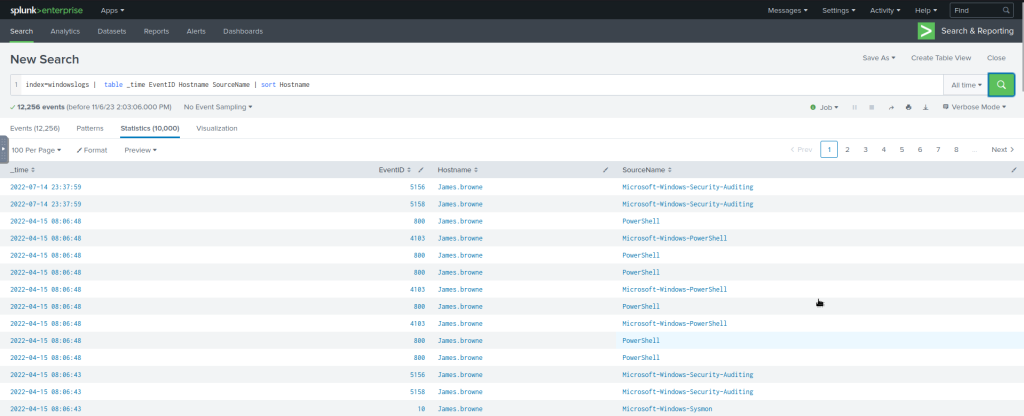
Reverse
| Command | reverse |
|---|---|
| Explanation | The reverse command simply reverses the order of the events. |
| Syntax | | reverse |
| Example | <Search Query> | reverse |
#Example Query

index=windowslogs | table _time EventID Hostname SourceName | reverse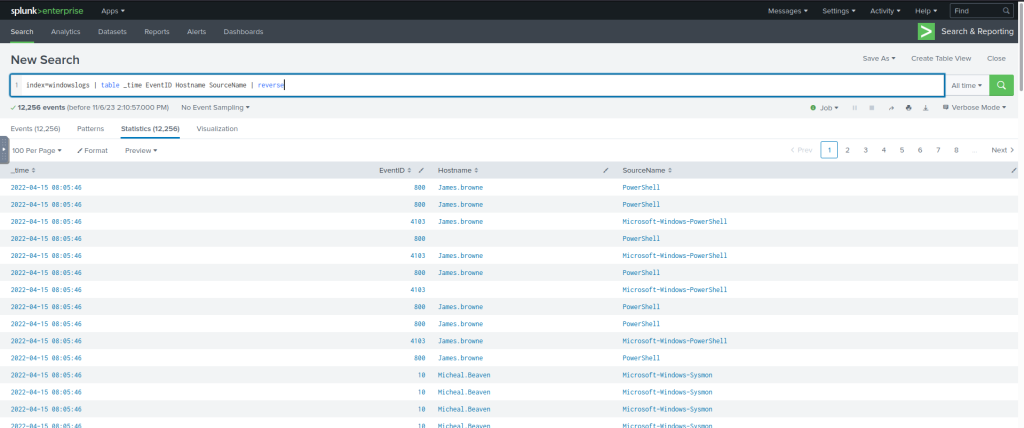
Transformational Commands in SPL
Transformational commands are those commands that change the result into a data structure from the field-value pairs. These commands simply transform specific values for each event into numerical values which can easily be utilized for statistical purposes or turn the results into visualizations. Searches that use these transforming commands are called transforming searches. Some of the most used transforming commands are explained below.
Top
| Command | top |
| Explanation | This command returns frequent values for the top 10 events. |
| Syntax | | top <field_name>| top limit=6 <field_name> |
| Example | top limit=3 EventID |
The following command will display the top 7 Image ( representing Processes) captured.
#Example Search Query
index=windowslogs | top limit=7 Image
Rare
| Command | rare |
| Explanation | This command does the opposite of top command as it returns the least frequent values or bottom 10 results. |
| Syntax | | rare <field_name>| rare limit=6 <field_name> |
| Example | rare limit=3 EventID |
index=windowslogs | rare limit=7 Image
Highlight
| Command | highlight |
| Explanation | The highlight command shows the results in raw events mode with fields highlighted. |
| Syntax | highlight <field_name1> <field_name2> |
| Example | highlight User, host, EventID, Image |
The following command will highlight the three mentioned fields in the raw logs
index=windowslogs | highlight User, host, EventID, Image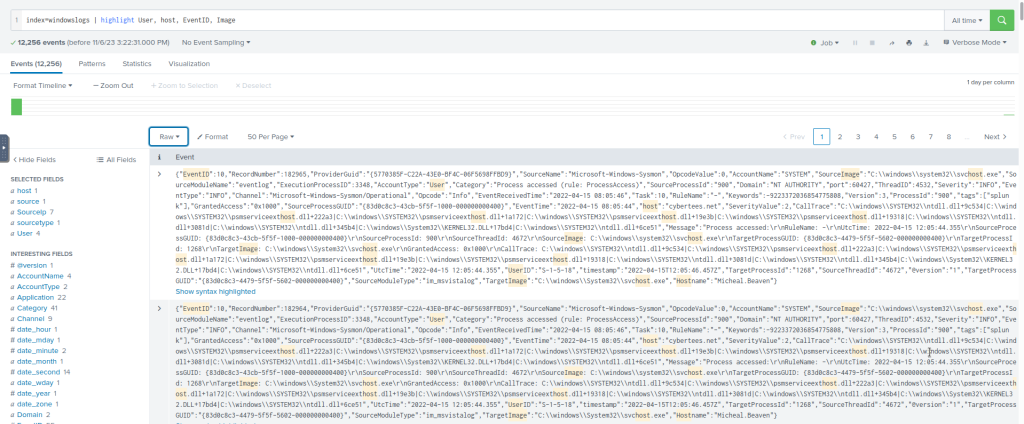
STATS Commands
SPL supports various stats commands that help in calculating statistics on the values. Some common stat commands are:
| Command | Explanation | Syntax | Example |
| Average | This command is used to calculate the average of the given field. | stats avg(field_name) | stats avg(product_price) |
| Max | It will return the maximum value from the specific field. | stats max(field_name) | stats max(user_age) |
| Min | It will return the minimum value from the specific field. | stats min(field_name) | stats min(product_price) |
| Sum | It will return the sum of the fields in a specific value. | stats sum(field_name) | stats sum(product_cost) |
| Count | The count command returns the number of data occurrences. | stats count(function) AS new_NAME | stats count(source_IP) |
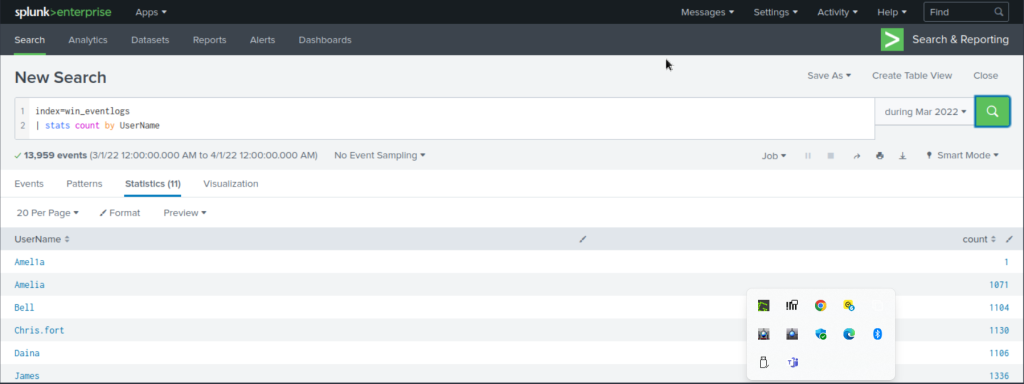
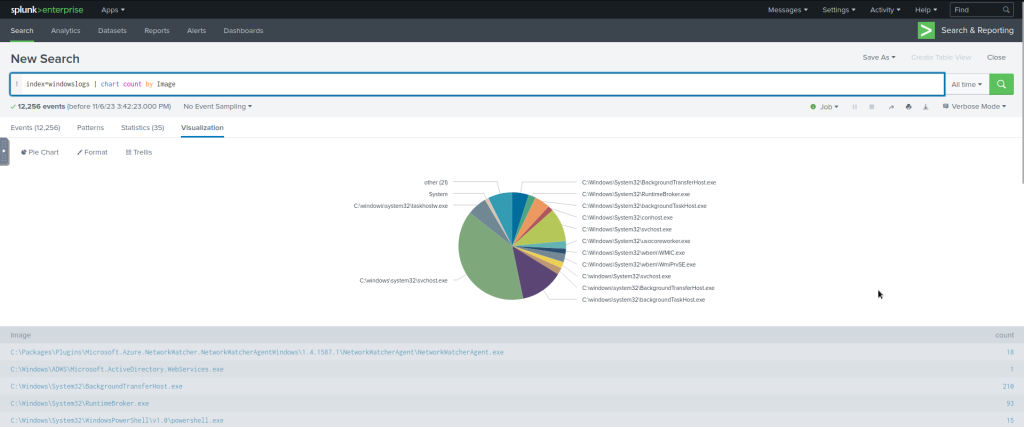
Splunk Chart Commands
Chart
| Command | chart |
| Explanation | The chart command is used to transform the data into tables or visualizations. |
| Syntax | | chart <function> |
| Example | | chart count by User |
#Search Query:
index=windowslogs | chart count by User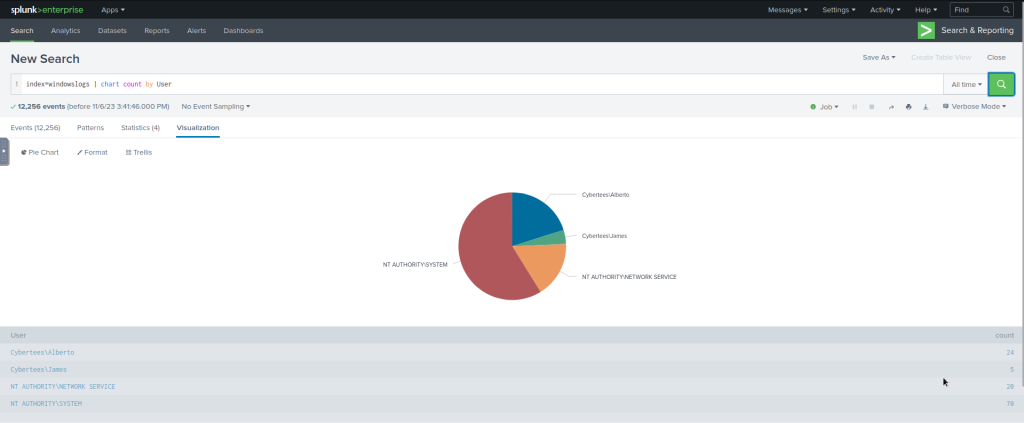
#Search Query:
index=windowslogs | chart count by User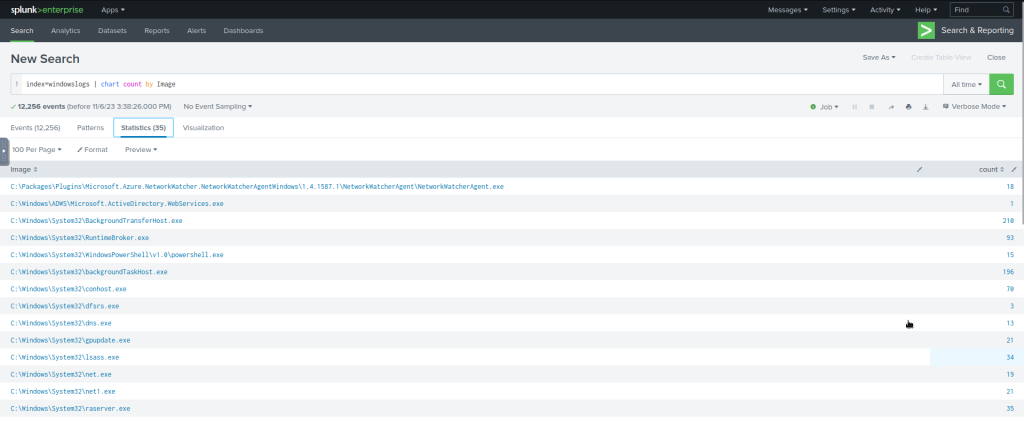
Timechart
| Command | timechart |
| Explanation | The timechart command returns the time series chart covering the field following the function mentioned. Often combined with STATS commands. |
| Syntax | | timechart function <field_name> |
| Example | | timechart count by Image |
The following query will display the Image chart based on the time.
#Search Query:
index=windowslogs | timechart count by Imag