
![Using MITRE ATT&CK Navigator to Strengthen Threat Modelling [PART: II]](https://i0.wp.com/netwerklabs.com/wp-content/uploads/2026/10/DE1001.png?fit=2048%2C768&ssl=1)

Views: 4
🎯 A Hands-On, Step-by-Step Walkthrough


📚 1. Why Map a Threat Group at All?
A threat model that stops at “we might get hacked” is not much use. ATT&CK lets you say something far more specific: “this group tends to gain initial access this way, move laterally that way, and these are the techniques we can’t currently detect.”
The Navigator turns that knowledge into a visual matrix you can colour, score, comment on, and share. Mapping a group takes four moves:
- 🧱 Create a layer
- 🔍 Search and select the group’s techniques
- 🧮 View, sort and filter the matrix
- 🖍️ Annotate with colours, scores, comments, links and metadata
🧰 2. Prerequisites
- A running ATT&CK Navigator instance (mine is self-hosted in my lab)
- A browser
- 20 minutes ☕
Optional: spin up your own Navigator
If you don’t have an instance yet, you can run the open-source Navigator locally. Check the project README for the current Node/Angular requirements, as they change between releases.
git clone https://github.com/mitre-attack/attack-navigator.git
cd attack-navigator/nav-app
npm install
npx ng serve --host 0.0.0.0
# then browse to http://<your-host>:4200
⚠️ Keep the Navigator version consistent when you compare results across machines or colleagues. Technique counts and group-to-technique mappings change between ATT&CK versions, so a layer built on one version can look different on another.
🚀 3. Mapping APT41
Who is APT41?
APT41 is tracked in ATT&CK as group G0096. It is widely known for blending state-sponsored espionage with financially motivated intrusions, and it is also tracked under other names such as Wicked Panda and Brass Typhoon. Open the group’s page in ATT&CK to see the current alias list and the techniques it is linked to.
💡 Why this group is a good exercise: its behaviour spans the whole kill chain, from internet-facing exploitation and supply-chain compromise to credential theft and data collection. That makes it a good test of whether every column of your matrix means something to you.
🟦 Step 1: Open the Navigator landing page
Browse to your instance (e.g. http://<your-navigator-host>:4200) or use the one hosted in Github https://mitre-attack.github.io/attack-navigator/. The landing page gives you four options:
| Option | What it does |
|---|---|
| Create New Layer | Start from an empty matrix |
| Open Existing Layer | Load a saved layer from a file or URL |
| Create Layer from Other Layers | Merge or inherit properties from layers you already have |
| Create Customized Navigator | Generate a hyperlink to a pre-configured Navigator |
The Landing page of the MITRE ATT&CK Navigator.

🟩 Step 2: Create a new Enterprise layer
- Click Create New Layer.
- Choose one of the three domains:
- Enterprise: techniques used against enterprise networks (Windows, Linux, macOS, cloud, SaaS)
- Mobile: techniques targeting phones and tablets
- ICS: techniques targeting industrial control systems
- Pick Enterprise. APT41 operates mainly against enterprise environments, so this is where it lives.
- If you need a specific ATT&CK version, expand More Options first and choose it there.
You should now see the full matrix, with tactic columns running left to right: Reconnaissance, Resource Development, Initial Access, Execution, Persistence, Privilege Escalation, Defense Evasion, Credential Access, Discovery, Lateral Movement, Collection, Command and Control, Exfiltration, Impact.

🟪 Step 3: Find APT41 with the Selection Controls
One of the most powerful tools on offer is the search menu, which allows you to see a list of APTs, malware, mitigations, and even some specific attacks, referred to as “Campaigns”.
- In the toolbar, find the Selection Controls group (lock, magnifier, and deselect icons).
- Click the magnifier 🔍. A search panel opens on the right.
- Type
APT41into the search box.
The panel lists matches under six headings:
- Techniques
- Threat Groups
- Software
- Mitigations
- Campaigns
- Data Sources
You can also adjust the Search Settings (name, ATT&CK ID, description, data sources) to control what the search looks at.
🧠 Watch out: a search for
APT41may return more than one entry under Threat Groups, because another group’s description can mention APT41. In my case I made sure I picked the APT41 entry itself rather than a similar-looking one. Always check the name before you click.

🟧 Step 4: Preview, then select the group’s techniques
- Under Threat Groups, hover over the APT41 entry. Every technique linked to that group lights up in the matrix. This is a free preview, and nothing is committed yet.
- Click select next to APT41.
The highlighted techniques are now a selection that you can annotate as a block.

- Look at the deselect (✕) button in the Selection Controls. It now shows a number, which is how many techniques are currently selected. Hover over it to see the tooltip (for example, “deselect N techniques”).

📝 Write that number down. It will differ between ATT&CK versions.
🟥 Step 5: Fine-tune with right-click
Sometimes you need to adjust one technique, not the whole group. Right-click any technique to open the context menu:
| Menu item | Use it to… |
|---|---|
| select / add to selection / remove from selection | Change the selection one technique at a time |
| select all / deselect all / invert selection | Bulk operations |
| select annotated / select unannotated | Work only on techniques you have (or haven’t) annotated |
| select all / deselect all techniques in tactic | Act on a whole column |
| view technique / view tactic | Open the official ATT&CK page |
| pin / unpin tooltip | Keep the technique tooltip on screen |

🟦 Step 6: View, sort and filter with the Layer Controls
The Layer Controls group is where you shape what you see. Four features matter most for this exercise.

You can define a custom name for the Layer from Layer Controls –> Layer Settings,


6.1 📤 Export
Download the layer as JSON, Excel, or SVG. The JSON can be re-imported into any Navigator later, and the SVG is ideal for reports and slides. (More in Step 9.)

6.2 🧪 Filters
Filter the matrix by platform. The options include Linux, macOS, Windows, Network, PRE, Containers, Office 365, SaaS, Google Workspace, IaaS and Azure AD.
Try this as an experiment:
- Open the filter dropdown.
- Tick Windows only. Note how the matrix shrinks to what applies to your estate.
- Switch to IaaS and see what remains. Record the count under a tactic that matters to you, such as Discovery.
This is the quickest way to answer “which of APT41’s techniques actually apply to my platforms?”

Windows:

IaaS:

6.3 🔤 Sorting
Sort the techniques alphabetically (ascending or descending), or by score once you have scored them. Hover over the icon to see which sort mode is active.

6.4 🌳 Expand sub-techniques
Click expand sub-techniques to reveal everything beneath each technique, for example the specific interpreters under Command and Scripting Interpreter. Click it again to collapse. Sub-technique level is where detection engineering usually happens, so expand before you start scoring.


🖍️ Step 7: Annotate with the Technique Controls
Now the fun part. With APT41’s techniques still selected, use the Technique Controls panel. From left to right:

| Icon | Control | What to do with it |
|---|---|---|
| ▨ | Toggle state | Grey out techniques that don’t apply to you |
| 🪣 | Background colour | Group and prioritise visually |
| 📊 | Scoring | Rate impact, likelihood, or coverage |
| 💬 | Comment | Add notes and observations |
| 🔗 | Link | Attach references (reports, tickets, detection rules) |
| 📋 | Metadata | Add custom tags and labels |
| 🧹 | Clear annotations on selected | Reset if you change your mind |
7.1 ⬜ Toggle state (disable what’s out of scope)
Select the techniques that can’t apply to your environment and click toggle state. They turn grey and no longer distract you.

7.2 🎨 Colour Setup
Select a group of techniques, click the paint bucket, and pick a colour from the palette.


Let us map the TTPs of APT41 using the “Backgroung Colour” option under the “Technique Controls”.

Alternatively, we can use the Color setup in Layer Controls in combination with the Scoring (refer 7,3) to apply colours based on Scores (low to high). This is the most useful method for most of the use cases.

7.3 📊 Scoring
A score is a numeric value assigned to a technique. The meaning or interpretation of scores is completely up to the user user – the Navigator simply visualizes the matrix based on any scores you have assigned. Some possible uses of scores include:
- Assigning a score to techniques based on whether a given adversary group has been observed to use that technique.
- Assigning a score to techniques based on your organization’s ability to detect, prevent and/or mitigate the use of a particular technique.
- Assigning a score to those techniques that a red-team has successfully employed during an exercise.
By default, techniques are “unscored” meaning that no score has been assigned to the technique. Note that “unscored” and a score of zero are not the same, specifically with respect to automatically assigned colors.

Let’s take our APT41 example and explore two possible use cases.
7.3.1 📊 USE CASE: Comparing two Threat Groups
Step 1: Create Layer 1 (Threat Group A)
- Open the MITRE ATT&CK Navigator.
- Click Create New Layer -> select Enterprise.
- Click the Selection button (magnifying glass) in the toolbar. Search for your first threat group (e.g., APT41) under the Threat Groups dropdown and click Select.
- Click the Score button (coin icon) and assign these techniques a score of
1. - In the Layer Settings (gear icon), change the layer name to
Group_A. Note its tab identifier at the top of your browser (usuallya). [1, 2, 3, 4, 5]
Color Setup used for Group_A in Layer Control:


Step 2: Create Layer 2 (Threat Group B)
- Click the
+icon at the top of the Navigator to open a new tab. - Click Create New Layer -> select Enterprise.
- Open the Selection menu, search for your second threat group (e.g., APT29), and click Select.
- Click the Score button and assign these techniques a score of
2. - Change the layer name to
Group_B. Note its tab identifier (usuallyb). [1, 2, 3, 4]
Color Setup used for Group_B in Layer Control:


Step 3: Combine and Overlap the Groups
- Click the
+icon to open a new tab. - Select Create Layer from Expression.
- In the score expression field, type:
a + b. - Click Create. [1, 2, 3]


Step 4: Interpret the Numerical Results
Your combined matrix will display individual technique boxes populated with computed values. The math maps out their shared and distinct characteristics: [1]
| Resulting Score | Threat Intelligence Meaning | Analytical Explanation & Takeaway |
|---|---|---|
| 0 | Unused by either actor. | Not relevant to this specific comparative threat profile. |
| 1 | Unique to Group A only. | TTPs exclusive to Group A. Focus on these if you are specifically targeted by Group A rather than Group B. |
| 2 | Unique to Group B only. | TTPs exclusive to Group B. Represents the distinct operational signature of the second actor. |
| 3 | Shared Overlap (Both Groups). | High-Priority Synergy. TTPs utilized by both actors. Defending against these yields the highest ROI for your SOC. |
Step 5: Color-Code the Matrix View
To translate these numbers into an immediate, presentation-ready visual: [1, 2]
- In the combined layer, click the Color Setup button (paint palette). [1]
- Set the Min value to
1and the Max value to3. [1, 2] - Modify the gradient color stops to assign highly distinct shades:
- Score 1 (Group A only) → Red
- Score 2 (Group B only) → Green
- Score 3 (Shared Overlap) → Blue


Interpret the Calculated Results
| Resulting Score | Behavioral Meaning | Threat Intelligence Profile & Focus |
|---|---|---|
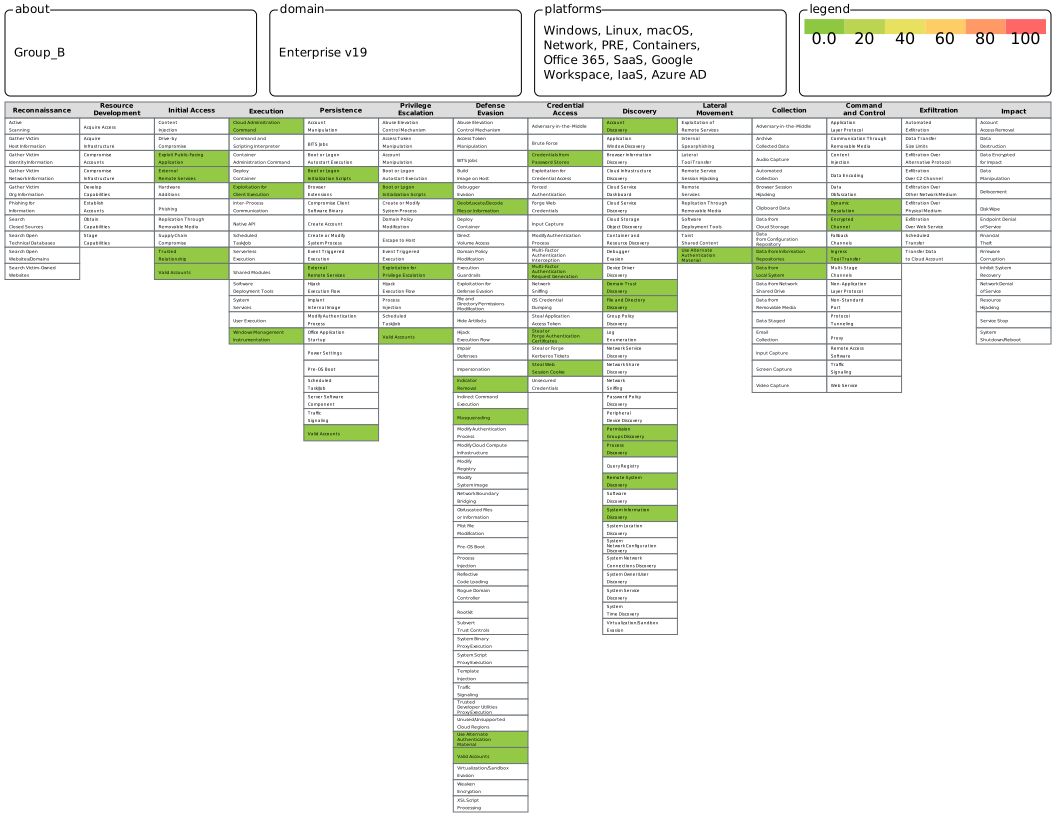
| Score 1 (Red) | Group_A Only | Stealth, Cloud, & Identity Dominance. Reflects focus on stealthy supply-chain compromises (e.g., SolarWinds), heavy targeting of Microsoft 365/Azure environment tokens, and quiet operational infrastructure. |
| Score 2 (Green) | Group_B Only | Software Exploitation & Dual-Motivations. Reflects aggressive weaponization of zero-day vulnerabilities (e.g., Log4j), extensive use of custom ransomware/crypto-mining for personal financial gain, and massive software supply-chain compromises (e.g., ASUS). |
| Score 3 (Blue) | Shared Overlap | The Enterprise Baseline. Both groups rely heavily on core system utilities like PowerShell (T1059.001), Valid Accounts (T1078), and web-service exfiltration. |
Executive Summary of the Results:
When explaining this map to your leadership or security operations team, present the data using these three core threat intelligence conclusions:
1. The Blue Cells (Score 3) = Your High-ROI Detection Baseline
The overlap cells demonstrate that despite having entirely different geopolitical objectives, both groups utilize identical fundamental mechanics once inside a network. They rely heavily on Living off the Land (LotL) techniques. Prioritizing detections for OS Credential Dumping (T1003) or Process Injection (T1055) provides dual-value protection against both actors simultaneously. [1, 2, 3, 4]
2. The Red Cells (Score 1) = The Identity & Cloud Challenge (APT41)
Group_A’s signature is identity-centric. They excel at compromising authentication mechanisms rather than spamming noisy exploits. If your organization is a government agency, think tank, or high-value policy target, the Blue cells tell you that your defenses must focus on OAuth token abuse, identity provider logging, and anomalous cross-tenant cloud activity. [1, 2, 3]
3. The Yellow Cells (Score 2) = The Edge Infrastructure Challenge (APT29)
Group_B is historically aggressive with perimeter exploitation. Their signature involves mass-scanning public-facing infrastructure to drop web shells. Furthermore, because they operate both state-sponsored espionage and rogue financial cybercrime operations, their toolset is vast and includes custom malware strains. The Yellow cells tell you that defense requires strict external attack surface management, rapid patch deployment pipelines, and endpoint isolation capabilities.
7.4 💬 Comments
Hover over a technique to see its tooltip, which shows the technique name and ID, its score, and your comment. Write comments that your future self can act on. For example:
“Internet-facing web app is in scope. Patch cadence is monthly, so exposure window is up to 30 days. WAF in detect-only mode.”


7.5 🔗 Links
Add a label and a URL so the technique points to something useful: the vendor advisory, an internal runbook, a detection rule, or the ATT&CK page itself. You can add several links to one technique and remove them individually.
7.6 📋 Metadata
Add key/value tags. Good candidates:
| Name | Example value |
|---|---|
owner | SOC / Infra / AppSec |
asset | customer-db |
detection-status | none / partial / tested |
ticket | SEC-1234 |


📸 SNAPSHOT 9: Technique tooltip showing score and comment, plus the link dialog

💾 Step 8: Export and reuse your layer
From the Layer Controls, export:
| Format | Best for |
|---|---|
| JSON | Saving your work and re-importing it later (all annotations included) |
| Excel | Sharing with managers and auditors, and filtering in a spreadsheet |
| SVG | Pasting a crisp image into reports, slides and blog posts |

To reload a layer later, use Open Existing Layer on the landing page and load the JSON file.
🗂️ Housekeeping tip: name files with the group, date and ATT&CK version, e.g.
apt41_2026-10_enterprise.json. Versions matter when you compare layers over time.
Exported as SVG:

Group_B:
🧮 4. Turning the Map Into a Decision
A coloured matrix is only useful if it changes what you do next. Take your red and orange cells and build a short priority table:
| # | Technique (ID) | Tactic | Why it matters here | Score | Next action |
|---|---|---|---|---|---|
| 1 | e.g. Exploit Public-Facing Application (T1190) | Initial Access | Internet-facing services in scope | 5 | Patch SLA, WAF in block mode |
| 2 | your pick | ||||
| 3 | your pick | ||||
| 4 | your pick |
For each row, open the technique’s ATT&CK page and read the Mitigations and Detection sections. They tell you what controls to apply and which logs to collect, which is exactly the input a threat model needs.
How to prioritise
- 🥇 Initial Access and Execution first. Stopping the attacker early shrinks everything downstream.
- 🥈 Credential Access and Privilege Escalation next. These decide whether a foothold becomes a breach.
- 🥉 Then Collection, Exfiltration and Impact, guided by your most critical assets (customer data, transaction records, PII, intellectual property).
- 🔁 Don’t forget availability. A technique that doesn’t touch your data can still hurt you if it takes services down.
⚠️ 5. Common Pitfalls
- Treating the map as a checklist of everything the group has ever done. ATT&CK lists documented behaviour. Absence of a technique is not proof the group can’t use it.
- Mixing ATT&CK versions. Counts and mappings shift between releases. Record the version in your file name.
- Selecting the wrong threat group entry. Always check the name before clicking select.
- Colouring without a legend. If it isn’t written down, a colleague can’t read your layer. Add the legend as a layer description or as metadata.
- Skipping sub-techniques. Detection logic is written at sub-technique level, so expand before you score.
- Scoring once and forgetting. Revisit the layer after each control improvement, so your greens are earned.

