

Views: 110
Splunk Log Parsing and Transformation Configuration
Splunk needs to be properly configured to parse and transform the logs appropriately. Some of the issues being highlighted are:
- Event Breaking:
- Ensure Splunk correctly breaks events for proper indexing and searching.
- Multi-line Events:
- Configure Splunk to handle multi-line events properly to avoid data misinterpretation.
- Masking (PCI DSS Compliance):
- Sensitive data (e.g., credit card numbers) must be masked to comply with PCI DSS.
- Extracting Custom Fields:
- Remove redundant fields in weblogs to optimize log storage and retrieval.
Splunk Data Parsing Guide
Data parsing in Splunk involves extracting relevant fields and transforming the data into a structured format for efficient analysis.
Step 1: Understand the Data Format
- Identify the format of your data (CSV, JSON, XML, syslog, etc.).
- Determine relevant fields for extraction.
Step 2: Identify the Sourcetype
- Sourcetype defines the data format for indexing.
- If no predefined sourcetype exists, create a custom one.
Step 3: Configure props.conf
- The
props.conffile is located in$SPLUNK_HOME/etc/system/local. - Example configuration:
  [source::/path/to/your/data]
  sourcetype = your_sourcetype
Step 4: Define Field Extractions
- Use regular expressions or pre-built techniques.
- Example field extraction in
props.conf:
  [your_sourcetype]
  EXTRACT-fieldname1 = regular_expression1
  EXTRACT-fieldname2 = regular_expression2
Step 5: Save and Restart Splunk
- Apply changes by saving
props.confand restarting Splunk.
Step 6: Verify and Search the Data
- Use Splunk search to confirm correct parsing and field extraction.
Splunk Configuration Files and Stanzas
Key Splunk Configuration Files
inputs.conf
- Purpose: Defines data inputs and collection methods.
- Example: Monitoring a log file:
  [monitor:///path/to/logfile.log]
  sourcetype = my_sourcetype
props.conf
- Purpose: Specifies parsing rules for field extractions.
- Example: Extracting fields using regular expressions:
  [my_sourcetype]
  EXTRACT-field1 = regular_expression1
  EXTRACT-field2 = regular_expression2
transforms.conf
- Purpose: Defines field transformations and enrichments.
- Example: Adding a new field based on existing values:
  [add_new_field]
  REGEX = existing_field=(.*)
  FORMAT = new_field::$1
indexes.conf
- Purpose: Configures indexes, storage, and retention policies.
- Example: Creating a new index:
  [my_index]
  homePath = $SPLUNK_DB/my_index/db
  coldPath = $SPLUNK_DB/my_index/colddb
  thawedPath = $SPLUNK_DB/my_index/thaweddb
  maxTotalDataSizeMB = 100000
outputs.conf
- Purpose: Defines output destinations for indexed data.
- Example: Forwarding data to a remote Splunk indexer:
 [tcpout]
defaultGroup = my_indexers

[tcpout:my_indexers]
server = remote_indexer:9997
authentication.conf
- Purpose: Manages authentication settings.
- Example: Enabling LDAP authentication:
  [authentication]
  authSettings = LDAP

  [authenticationLDAP]
  SSLEnabled = true
Common Stanzas in Splunk Configurations
Splunk configurations contain various stanza configurations that define how data is processed and indexed. These stanzas have a certain purpose, and it’s important to understand what these are and how they are used. A brief summary of the common stanzas are listed below:
| Stanza | Explanation | Example |
|---|---|---|
[sourcetype] | Specifies the configuration for a specific sourcetype. It allows you to define how the data from that sourcetype should be parsed and indexed. | [apache:access] – Configures parsing and indexing settings for Apache access logs. |
TRANSFORMS | Applies field transformations to extracted events. You can reference custom or pre-defined field transformation configurations to modify or create new fields based on the extracted data. | TRANSFORMS-mytransform = myfield1, myfield2 – Applies the transformation named “mytransform” to fields myfield1 and myfield2. |
REPORT | Defines extraction rules for specific fields using regular expressions. It associates a field name with a regular expression pattern to extract desired values. This stanza helps in parsing and extracting structured fields from unstructured or semi-structured data. | REPORT-field1 = pattern1 – Extracts field1 using pattern1 regular expression. |
EXTRACT | Defines extraction rules for fields using regular expressions and assigns them specific names. It is similar to the REPORT stanza, but it allows more flexibility in defining custom field extractions. | EXTRACT-field1 = (?<fieldname>pattern1) – Extracts field1 using pattern1 regular expression and assigns it to fieldname. |
TIME_PREFIX | Specifies the prefix before the timestamp value in events. This stanza is used to identify the position of the timestamp within the event. | TIME_PREFIX = \[timestamp\] – Identifies the prefix [timestamp] before the actual timestamp in events. |
TIME_FORMAT | Defines the format of the timestamp present in the events. It allows Splunk to correctly extract and parse timestamps based on the specified format. | TIME_FORMAT = %Y-%m-%d %H:%M:%S – Specifies the timestamp format as YYYY-MM-DD HH:MM:SS. |
LINE_BREAKER | Specifies a regular expression pattern that identifies line breaks within events. This stanza is used to split events into multiple lines for proper parsing and indexing. | LINE_BREAKER = ([\r\n]+) – Identifies line breaks using the regular expression [\r\n]+. |
SHOULD_LINEMERGE | Determines whether lines should be merged into a single event or treated as separate events. It controls the behavior of line merging based on the specified regular expression pattern in the LINE_BREAKER stanza. | SHOULD_LINEMERGE = false – Disables line merging, treating each line as a separate event. |
BREAK_ONLY_BEFORE | Defines a regular expression pattern that marks the beginning of an event. This stanza is used to identify specific patterns in the data that indicate the start of a new event. | BREAK_ONLY_BEFORE = ^\d{4}-\d{2}-\d{2} – Identifies the start of a new event if it begins with a date in the format YYYY-MM-DD. |
BREAK_ONLY_AFTER | Specifies a regular expression pattern that marks the end of an event. It is used to identify patterns in the data that indicate the completion of an event. | BREAK_ONLY_AFTER = \[END\] – Marks the end of an event if it contains the pattern [END]. |
KV_MODE | Specifies the key-value mode used for extracting field-value pairs from events. The available modes are: auto, none, simple, multi, and json. This stanza determines how fields are extracted from the events based on the key-value pairs present in the data. It helps in parsing structured data where fields are represented in a key-value format. | KV_MODE = json – Enables JSON key-value mode for parsing events with JSON formatted fields. |
Splunk Apps
Splunk apps are pre-packaged software modules or extensions that enhance the functionality of the Splunk platform. The purpose of Splunk apps is to provide specific sets of features, visualizations, and configurations tailored to meet the needs of various use cases and industries.
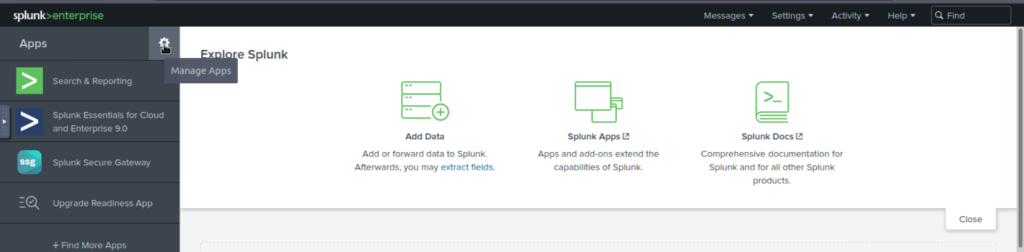
Creating a Simple App
Click on the Manage App tab as highlighted below:
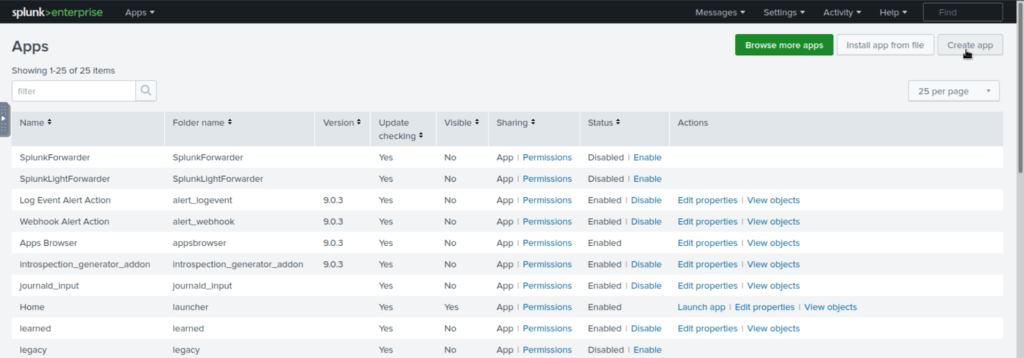
To create a new app, Click on the Create App tab as shown below:
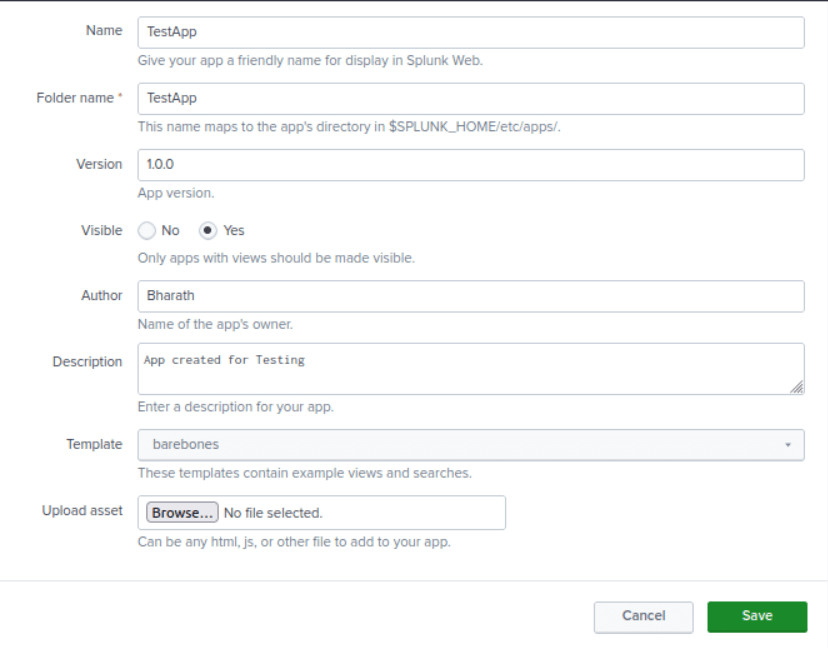
Next, fill in the details about the new app that you want to create. The new app will be placed in the /opt/splunk/etc/apps directory as shown below:
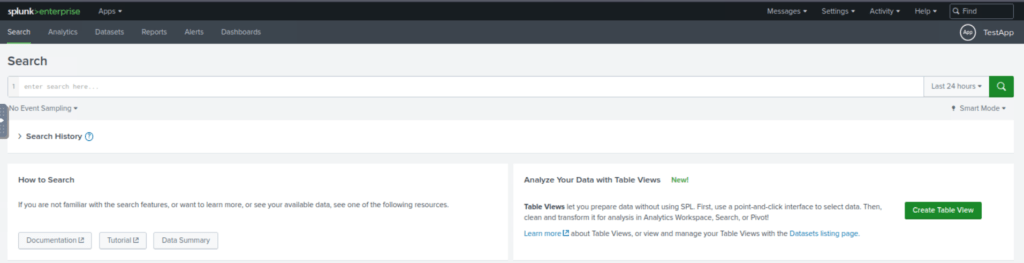
A new Splunk app has been created successfully and it can be shown on the Apps page. Click on the Launch App to see if there is any activity logged yet.
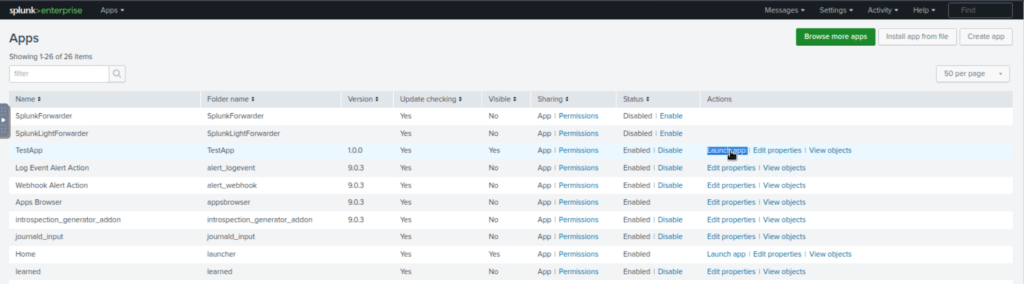
As seen, no activity has been logged yet. Let’s generate some traffic.
App directory
Exploring the Splunk App directory,
# /opt/splunk/etc/apps# ls
SplunkForwarder                splunk-dashboard-studio
SplunkLightForwarder           splunk_archiver
TestApp                        splunk_assist
alert_logevent                 splunk_essentials_9_0
alert_webhook                  splunk_gdi
appsbrowser                    splunk_httpinput
introspection_generator_addon  splunk_instrumentation
journald_input                 splunk_internal_metrics
launcher                       splunk_metrics_workspace
learned                        splunk_monitoring_console
legacy                         splunk_rapid_diag
python_upgrade_readiness_app   splunk_secure_gateway
sample_app                     user-prefs
search
Contents of the TestApp directory,
# ls TestApp
bin  default  local  metadata
Some of the key directories and files that are present in the app directory are explained briefly below:
| File/Directory | Description |
|---|---|
app.conf | Metadata file defining the app’s name, version, and more. |
bin (directory) | Holds custom scripts or binaries required by the app. |
default (directory) | Contains XML files defining app dashboards and views. |
local (directory) | Optionally used for overriding default UI configurations. |
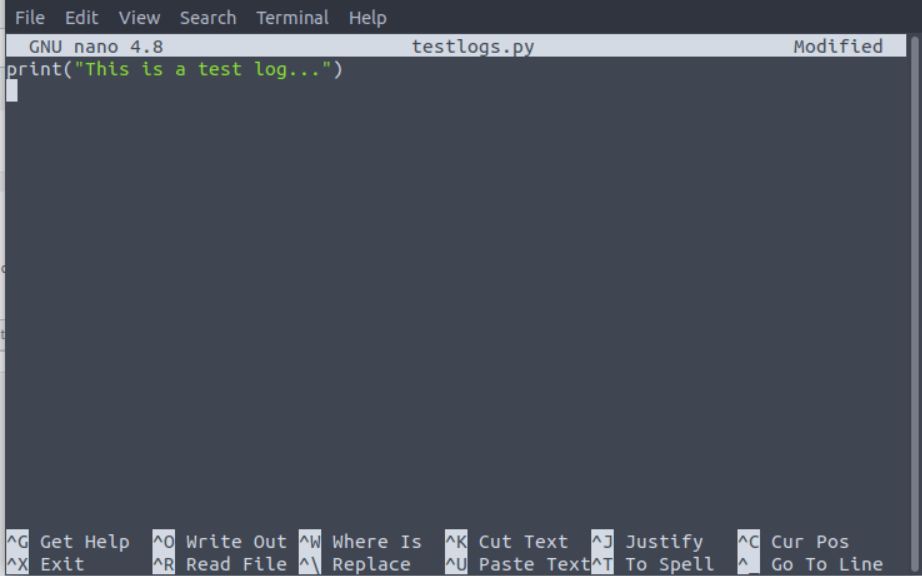
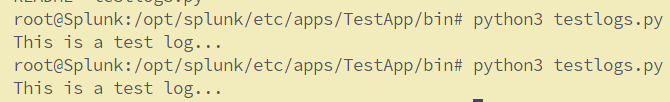
The bin directory contains the scripts required by the app, let’s create a simple Python script “testlogs.py‘ in the bin directory,
ls
README  testlogs.py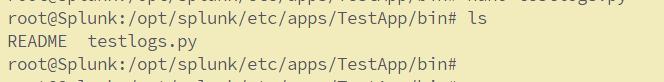
Let’s run the script file,
# python3 testlogs.py
This is a test log...
Creating Inputs.conf,
On Ubuntu, the inputs.conf file for Splunk is typically located in one of the following directories:

1. For system-wide configurations (global settings):

#/opt/splunk/etc/system/local/inputs.conf

2.For app-specific configurations:

#/opt/splunk/etc/apps/<app-name>/local/inputs.conf

3.For user-specific settings (rarely modified manually):

#/opt/splunk/etc/users/<username>/local/inputs.conf[script:///opt/splunk/etc/apps/TestApp/bin/testlogs.py]
index = main
source = test_log
sourcetype = testing
interval = 5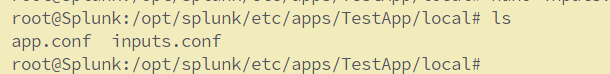
Restart Splunk using the command /opt/splunk/bin/splunk restart.
Execute thye script testlogs.py again and search for the logs,
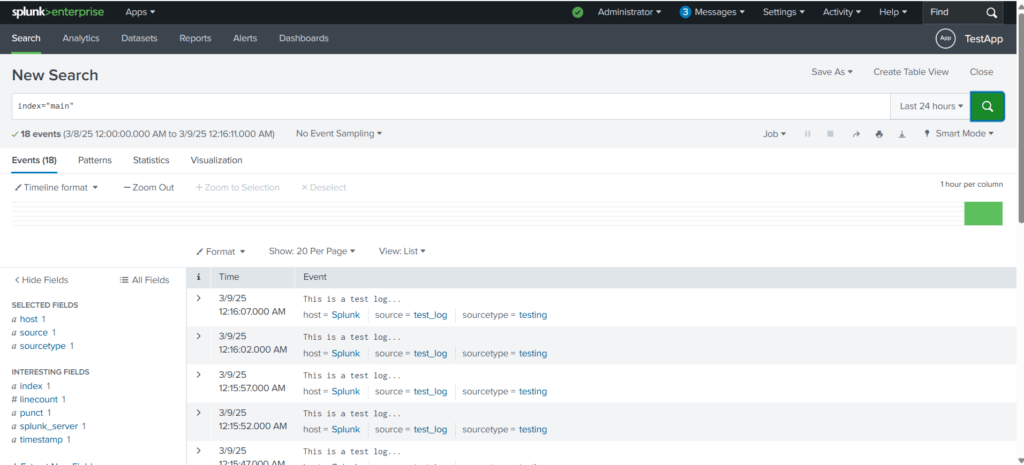
We have created a simple Splunk app, used the bin directory to create a simple Python script, and then created inputs.conf file to pick the output of the script and throw the output into Splunk in the main index every 5 seconds.
This is the end of Part I of the series on Data Manipulation in Splunk. In Part II of this series, we will explore more using the TestApp created in Part I.
Please follow Part II [here].

