Views: 178
Understanding Logs in Infrastructure Systems
Logs and Their Role
- Logs are time-sequenced messages recording events within a system, device, or application.
- Essential for insights into the inner workings of infrastructure systems, offering visibility into applications, networks, and security events.
Log Analysis
- Purpose: Log analysis makes sense of recorded events, revealing patterns and insights into infrastructure health and security.
- Function: Helps teams understand system behavior, diagnose issues, detect security threats, and ensure compliance.
What Are Logs?
Definition
- Logs are records of events or transactions in a system, device, or application.
- Events can relate to application errors, system faults, user actions, resource usage, and network connections.
Log Entry Components
- Timestamp: Date and time of the event.
- Source: System or IP address that generated the log.
- Severity: Classification of the event’s impact (e.g., Informational, Warning, Error, Critical).
- Action: Indicates the system’s response or the outcome of a policy (e.g., Alert, Deny).
- Event Context: Additional fields may include IP addresses, zones, applications, and actions, adding details to understand the event’s significance.
Sample Log Analysis
Jul 28 17:45:02 10.10.0.4 FW-1: %WARNING% general: Unusual network activity detected from IP 10.10.0.15 to IP 203.0.113.25. Source Zone: Internal, Destination Zone: External, Application: web-browsing, Action: Alert.- Timestamp: “Jul 28 17:45:02” indicates event timing.
- Source: “10.10.0.4” shows the originating system’s IP address.
- Severity: “%WARNING%” denotes a potential issue requiring attention.
- Event Details: Firewall detected unusual activity from an internal to an external IP, highlighting a possible security concern.
- Action: Alert issued, indicating policy set to notify on such events.
Importance of Logs
1. System Troubleshooting
- Analyzing errors and warnings assists IT teams in identifying and fixing system issues.
- Improves reliability by reducing downtime and enabling quick responses to problems.
2. Cybersecurity Incident Response
- Logs from firewalls, IDS, and authentication systems are vital for detecting threats and responding to security incidents.
- SOC teams use log analysis to investigate unauthorized access, malware, breaches, and other malicious actions.
3. Threat Hunting
- Security teams analyze logs proactively, searching for anomalies and Indicators of Compromise (IOCs).
- Helps uncover advanced threats that bypass standard security defenses.
4. Compliance
- Logs provide records of system activities, essential for regulatory audits and compliance.
- Regular log analysis supports adherence to regulations like GDPR, HIPAA, or PCI DSS.
Types of Logs in Computing Environments
- Application Logs
- Track application-specific messages, errors, warnings, and operational information.
- Audit Logs
- Record events, actions, and changes within systems or applications, creating a history of user and system activities.
- Security Logs
- Capture security-related events, such as login attempts, permission changes, and firewall activities.
- Server Logs
- Include system, event, error, and access logs, each providing data on server operations and status.
- System Logs
- Cover kernel activities, system errors, boot processes, and hardware information, helping diagnose system issues.
- Network Logs
- Document communication within a network, including connection events and data transfers, providing insights into network activity.
- Database Logs
- Detail database transactions, including queries, updates, and changes within the database environment.
- Web Server Logs
- Record web requests, including URLs, IP addresses, request types, and response codes, giving visibility into web traffic.
Integrative Analysis
- Effective cybersecurity analysis requires correlating multiple log types to get a comprehensive view of the environment’s security posture.
- Cross-referencing logs enhances the detection of suspicious patterns and supports investigative and preventative actions.
Data Visualization
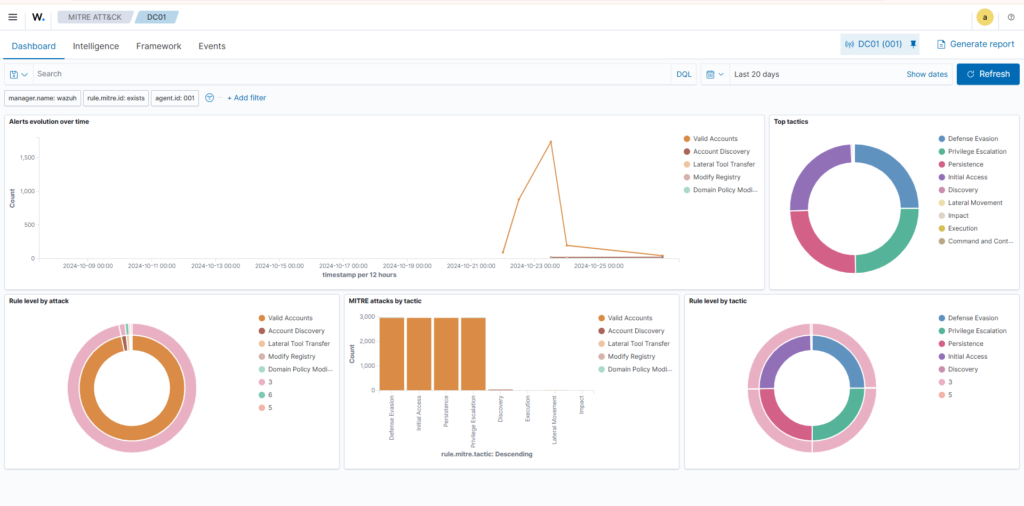
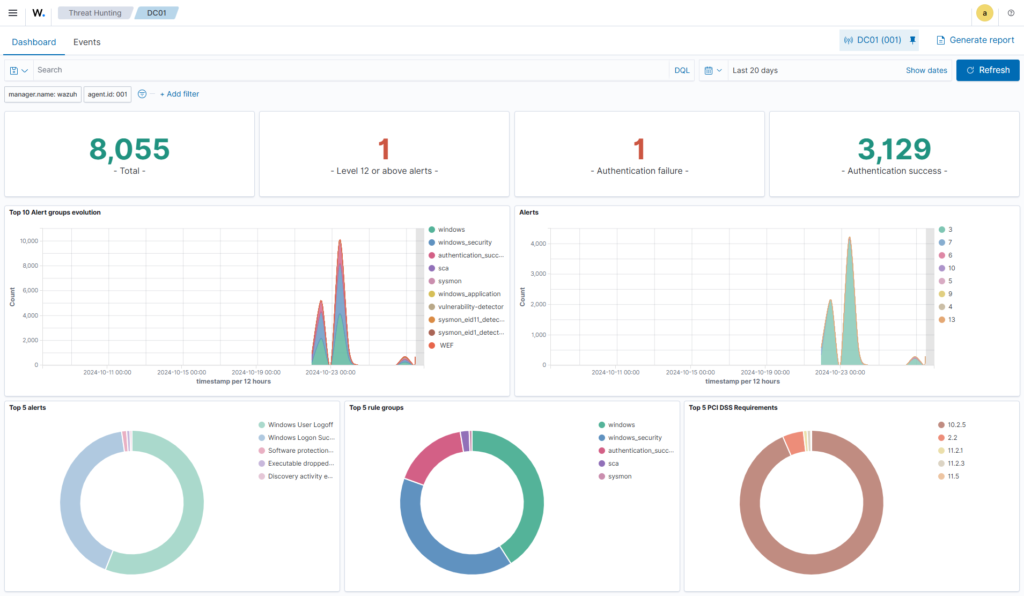
Data visualization tools, such as Kibana (of the Elastic Stack or Wazuh) and Splunk, help to convert raw log data into interactive and insightful visual representations through a user interface.


External Research and Threat Intel
Examples of threat intelligence include:
- IP Addresses
- File Hashes
- Domains
When analyzing a log file, we can search for the presence of threat intelligence. For example, While analysing the Apache2 web server log entries, we noticedthat an IP address has tried to access our site’s admin panel.
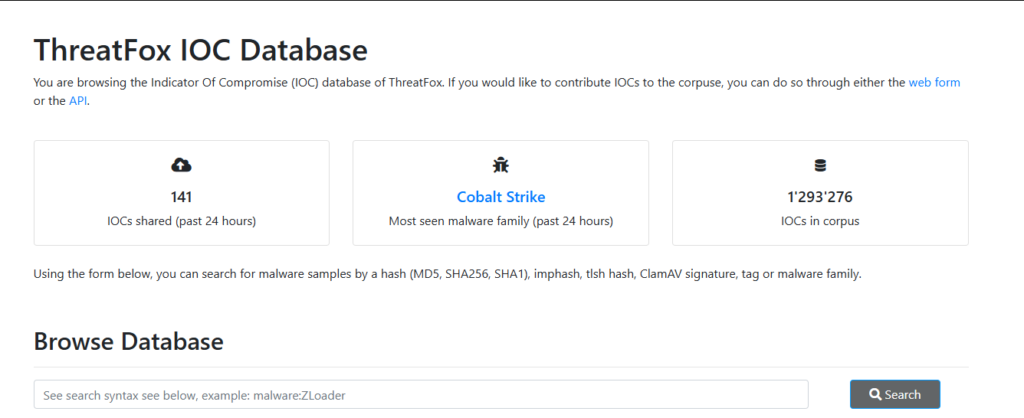
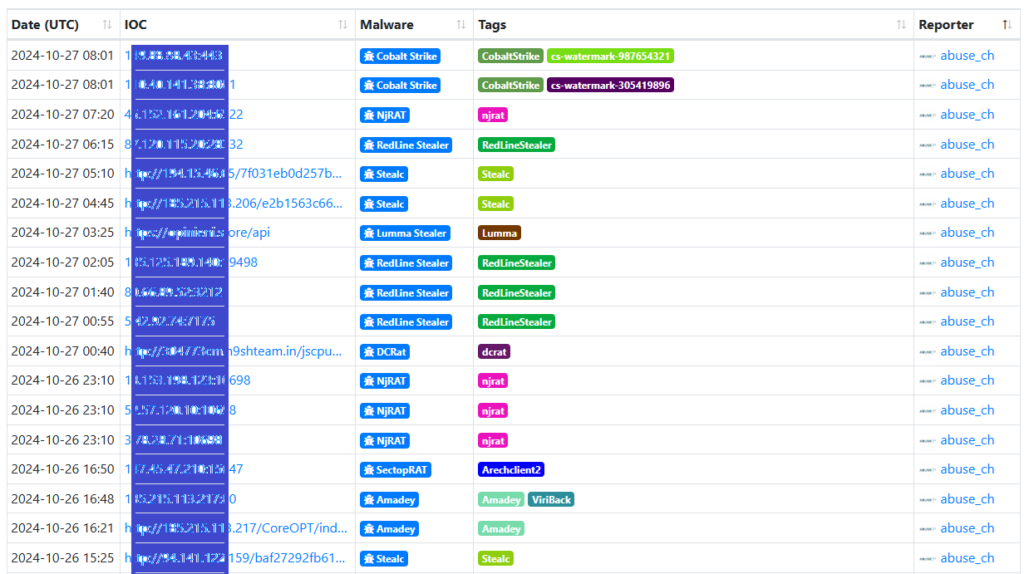
Using a threat intelligence feed like ThreatFox, we can search our log files for known malicious actors’ presence.


Common Log File Locations
Overview Understanding the locations of various log files generated by applications and systems is essential for effective log analysis, security monitoring, and threat detection. While paths may vary based on configurations and software versions, some standard locations exist.
Web Servers
- Nginx
- Access Logs:
/var/log/nginx/access.log - Error Logs:
/var/log/nginx/error.log
- Access Logs:
- Apache
- Access Logs:
/var/log/apache2/access.log - Error Logs:
/var/log/apache2/error.log
- Access Logs:
Databases
- MySQL
- Error Logs:
/var/log/mysql/error.log
- Error Logs:
- PostgreSQL
- Error and Activity Logs:
/var/log/postgresql/postgresql-{version}-main.log
- Error and Activity Logs:
Web Applications
- PHP
- Error Logs:
/var/log/php/error.log
- Error Logs:
Operating Systems
- Linux
- General System Logs:
/var/log/syslog - Authentication Logs:
/var/log/auth.log
- General System Logs:
Firewalls and IDS/IPS
- iptables
- Firewall Logs:
/var/log/iptables.log
- Firewall Logs:
- Snort
- Snort Logs:
/var/log/snort/
- Snort Logs:
Note: Always verify paths as they may vary with system configurations and software versions.
Common Patterns in Log Analysis
Overview Identifying common patterns in log data helps detect unusual activities and potential security incidents. Common patterns can signal abnormal user behavior, attack signatures, and more.
Abnormal User Behavior
Recognizing deviations from typical user actions is essential for detecting security threats. Automated log analysis tools can help identify unusual activities through baseline comparison, examples include:
- Detection Solutions: Splunk UBA, IBM QRadar UBA, Azure AD Identity Protection.
Indicators of Anomalous Behavior:
- Multiple failed login attempts: May indicate brute-force attempts.
- Unusual login times: Out-of-hours logins could indicate unauthorized access.
- Geographic anomalies: Logins from unusual IP locations may signal compromise.
- Frequent password changes: Multiple password resets in a short time may suggest unauthorized access.
- Unusual user-agent strings: Requests from unexpected user-agent strings (e.g., “Nmap Scripting Engine” or “Hydra”) might indicate automated attacks.
Note: Fine-tuning detection mechanisms is crucial to reduce false positives.
Common Attack Signatures
Overview Attack signatures refer to identifiable patterns left by cyberattacks in log files. Recognizing these patterns is essential for quick threat response.
SQL Injection
- Pattern: SQL injection attempts appear as unusual or malformed SQL queries.
- Indicators: Look for SQL keywords like single quotes (
'), comments (--,#), union statements (UNION), and time delays (SLEEP()). - Example:
10.10.61.21 - - [2023-08-02 15:27:42] "GET /products.php?q=books' UNION SELECT null, null, username, password, null FROM users-- HTTP/1.1" 200 3122Cross-Site Scripting (XSS)
- Pattern: XSS attacks often involve injected scripts or event handlers in web logs.
- Indicators: Look for
<script>tags and common JavaScript methods likealert(). - Example:
10.10.19.31 - - [2023-08-04 16:12:11] "GET /products.php?search=<script>alert(1);</script> HTTP/1.1" 200 5153Path Traversal
- Pattern: Path traversal attempts aim to access files outside a web app’s intended directories.
- Indicators: Look for traversal sequences like
../and access attempts to sensitive files (/etc/passwd,/etc/shadow). - Example:
10.10.113.45 - - [2023-08-05 18:17:25] "GET /../../../../../etc/passwd HTTP/1.1" 200 505Note: Path traversal attacks may be URL encoded, so it’s crucial to recognize encoded characters (%2E, %2F).
Command-Line Log Analysis Tools for Linux
Overview The Linux command line offers several built-in tools for quickly and effectively analyzing log files. These tools are invaluable for examining system activities, troubleshooting issues, and detecting security incidents, especially when a dedicated SIEM system is unavailable.
Basic Log Viewing Commands
cat- Purpose: Reads and displays the entire content of files.
- Example:
cat apache.log- Output: Displays the entire
apache.logfile.
- Output: Displays the entire
- Limitations: Not ideal for large files due to excessive output.
less- Purpose: Allows page-by-page navigation of large files.
- Example:
less apache.log- Output: Opens
apache.logfor scrolling with arrow keys,qto exit.
- Output: Opens
- Advantages: Efficient for large logs, easier navigation.
tail- Purpose: Displays the last few lines of a file, with an option to follow live updates.
- Example:
tail -f -n 5 apache.log-f: Follows log updates in real-time.-n 5: Shows the last 5 lines.
- Use Case: Real-time monitoring of new log entries.
head- Purpose: Shows the beginning lines of a file.
- Example:
head -n 10 apache.log-n 10: Displays the first 10 lines.
- Use Case: Quickly reviewing the start of a log file.
Log Statistics and Filtering Commands
wc- Purpose: Counts lines, words, and characters in a file.
- Example:
wc apache.log- Output: Shows total lines, words, and characters.
- Use Case: Quick understanding of log file size and data volume.
cut- Purpose: Extracts specific columns or fields from structured data.
- Example:
cut -d ' ' -f 1 apache.log-d ' ': Specifies space as the delimiter.-f 1: Extracts the first field (e.g., IP addresses).
- Use Case: Isolates specific details like IPs, URLs, or status codes.
sort- Purpose: Sorts output in ascending or descending order.
- Example:
cut -d ' ' -f 1 apache.log | sort -n-n: Sorts numerically.
- Reversed Order: Add
-rto reverse the order. - Use Case: Helps identify patterns in sorted data, such as repeated IPs.
uniq- Purpose: Removes duplicate lines from sorted input.
- Example:
cut -d ' ' -f 1 apache.log | sort | uniq -c-c: Counts occurrences of each unique line.
- Use Case: Identifies unique entries and their frequency, helpful for spotting recurring IPs or status codes.
Advanced Text Processing Commands
sed- Purpose: Stream editor for search and replace.
- Example:
sed 's/31\/Jul\/2023/July 31, 2023/g' apache.logs/old/new/g: Replaces all instances of “old” with “new”.
- Use Case: Replaces dates or specific strings in log entries.
- Caution: Use
-icarefully to modify files directly.
awk- Purpose: Processes and filters based on conditions.
- Example:
awk '$9 >= 400' apache.log$9: Refers to the 9th field (e.g., HTTP status code).>= 400: Filters for error status codes.
- Use Case: Extracts entries meeting specific criteria, such as HTTP errors.
grep- Purpose: Searches for patterns within files.
- Examples:
- Simple Search:
grep "admin" apache.log— Searches for “admin” in log entries. - Count Matches:
grep -c "admin" apache.log— Counts matching entries. - Line Numbers:
grep -n "admin" apache.log— Shows line numbers of matches. - Inverted Search:
grep -v "/index.php" apache.log— Excludes lines with “/index.php”.
- Simple Search:
- Use Case: Locates specific log entries or excludes irrelevant data.
Combining Commands
Combining commands using pipes (|) enables more powerful log analysis:
Example 1: Count unique IP addresses:
cut -d ' ' -f 1 apache.log | sort | uniq -cExample 2: Find HTTP errors excluding specific URLs:
grep -v "/index.php" apache.log | awk '$9 >= 400'


