Views: 516
Shipping OPNsense firewall logs to Splunk centralizes log management, allowing for seamless consolidation with other network and system logs. This integration enhances visibility into network traffic, enabling the identification of threats like port scans, malware communication, or brute force attacks. By correlating OPNsense logs with logs from other sources, organizations can perform faster root cause analysis during incidents, reconstruct attack vectors, and maintain detailed audit trails. Splunk’s automation features allow real-time alerts for critical events such as unauthorized access attempts or high-risk IP connections, streamlining incident response. Additionally, the centralized logging helps meet compliance requirements for frameworks like GDPR, PCI-DSS, and ISO 27001 by providing clear network activity records and security event logs.
Splunk’s advanced analytics and machine learning capabilities further enrich OPNsense log analysis by detecting patterns, predicting risks, and identifying anomalies. Integrating threat intelligence feeds with OPNsense logs enhances detection of known malicious actors and supports proactive network defense. Performance monitoring dashboards in Splunk offer insights into firewall metrics like throughput and bandwidth usage, enabling optimization and quick issue resolution. Scalable and customizable, Splunk supports dynamic reporting, visualization, and real-time tracking of network activity, ensuring that both small networks and enterprise environments benefit. By leveraging these capabilities, businesses transform raw firewall data into actionable insights, strengthening their security posture and operational efficiency.
To send OPNsense logs to Splunk, you can configure OPNsense to forward logs via Syslog to Splunk, where you can ingest and analyze them. Here’s a step-by-step guide:
Step 1: Set Up a Syslog Server in Splunk
In the Splunk Web interface:
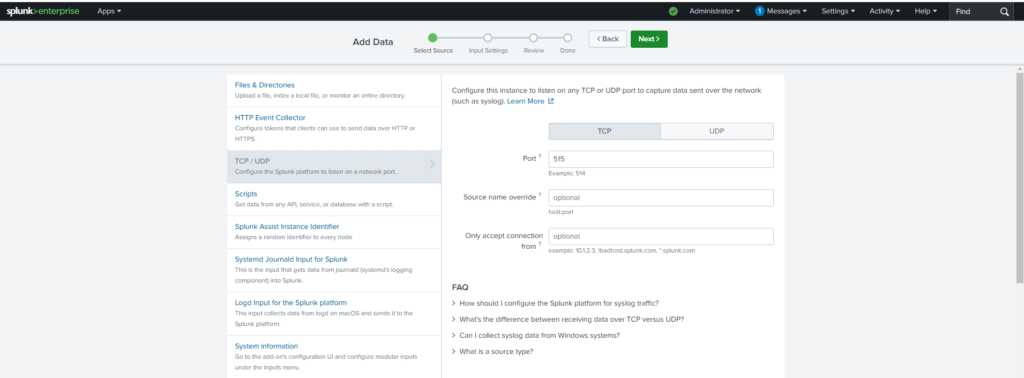
- Navigate to Settings > Data Inputs > TCP/UDP.
- Choose UDP (or TCP for more reliable transport).
- Click Add new.
- Configure the port (e.g.,
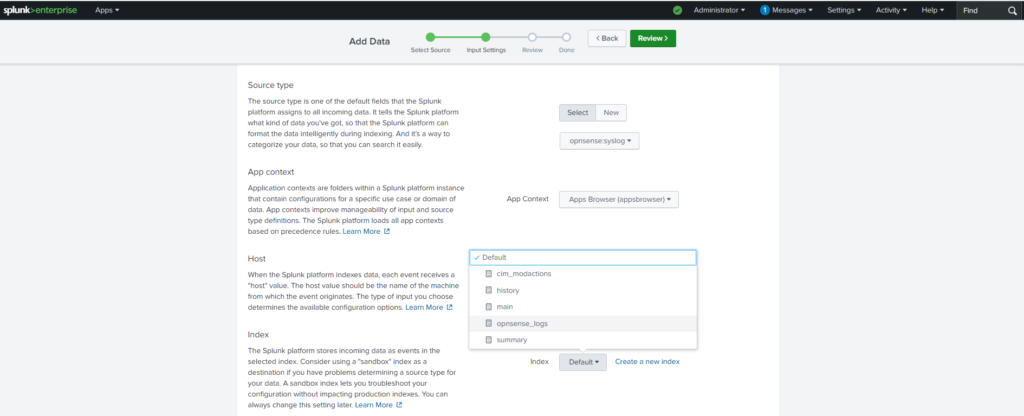
514for standard syslog). - Set a Source Type to
syslogor create a custom one (e.g.,opnsense_syslog). - Assign a relevant index for storing these logs (e.g.,
opnsense_logs).
Step 2: Configure OPNsense to Forward Logs
- Access OPNsense Web Interface:
- Log in to the OPNsense dashboard.
- Navigate to System Logs:
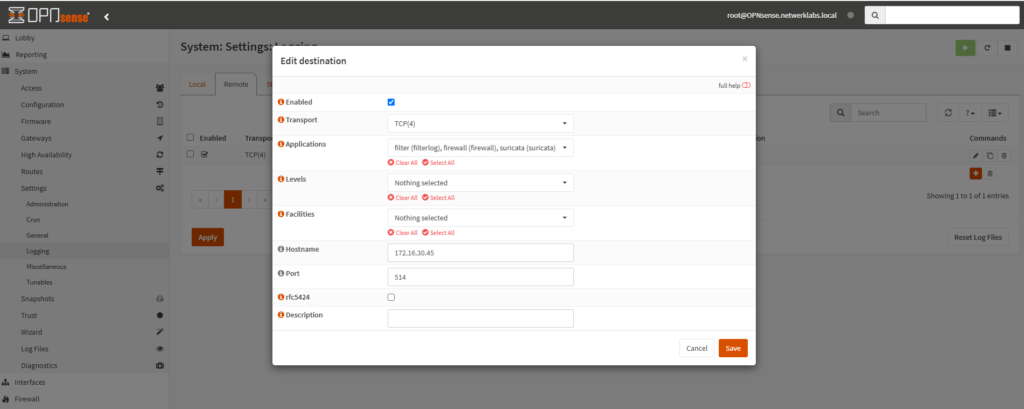
- Go to System > Settings > Logging / Remote.
- Add a Remote Syslog Server:
- Click + Add Target and configure the following:
- Type: Select
Syslog. - Transport: Choose
UDP(orTCPfor reliable delivery). - Hostname: Enter the IP address of your Splunk server.
- Port: Use the same port configured in Splunk (e.g.,
514). - Facility: Choose which types of logs to forward (e.g.,
Local0,Local1). - Severity: Set the log level (e.g.,
InformationalorDebug). - Format: Use
BSDorRFC 5424(ensure Splunk’s syslog configuration matches).
- Type: Select
- Click + Add Target and configure the following:
- Save and Apply Changes.
Step 3: Validate OPNSense Logs in Splunk
source="tcp:514" index="opnsense_logs" sourcetype="opnsense:syslog"
Step 4: Install OPNSense Add-Ons
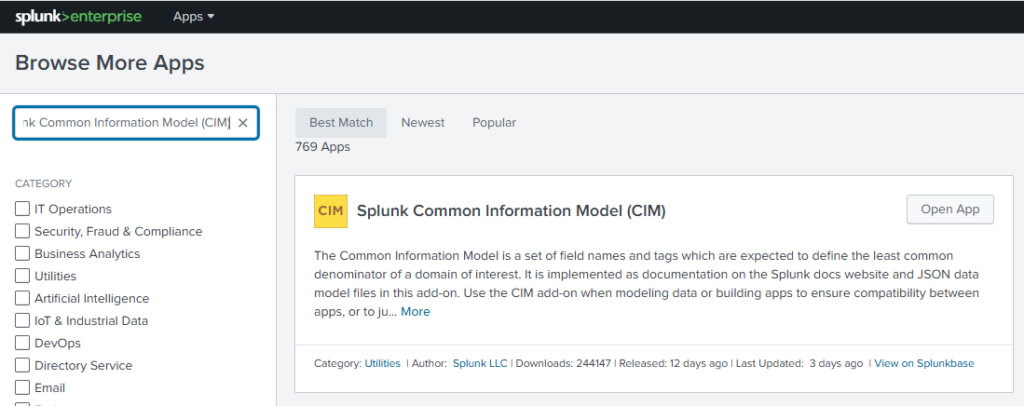
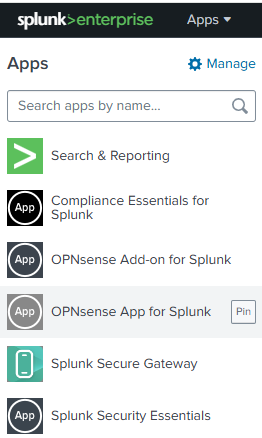
Install “OPNsense App for Splunk” and “OPNsense Add-on for Splunk” Apps from Splunkbase using your Splunk account.

Also, install the “Splunk Common Information Model (CIM)” app from Splunkbase.
Once configured, you’ll have real-time OPNsense logs in Splunk for detailed analysis and monitoring.
OPNSense Dashboard
Lauch the OPNsense App for Splunk Dashbord.
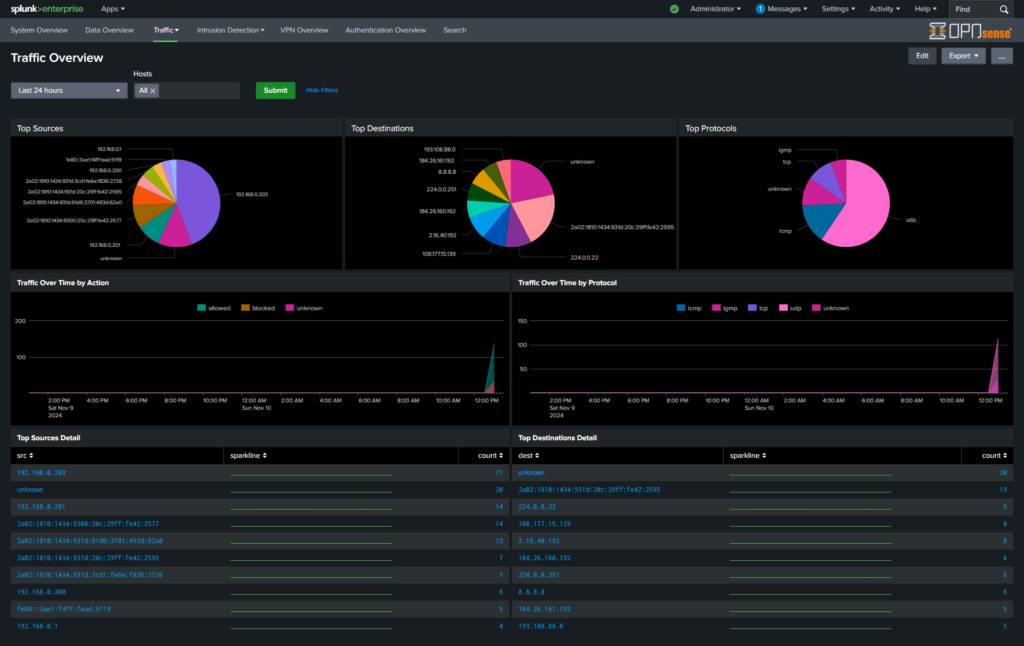
OPNSense logs are now visualised by Splunk App.
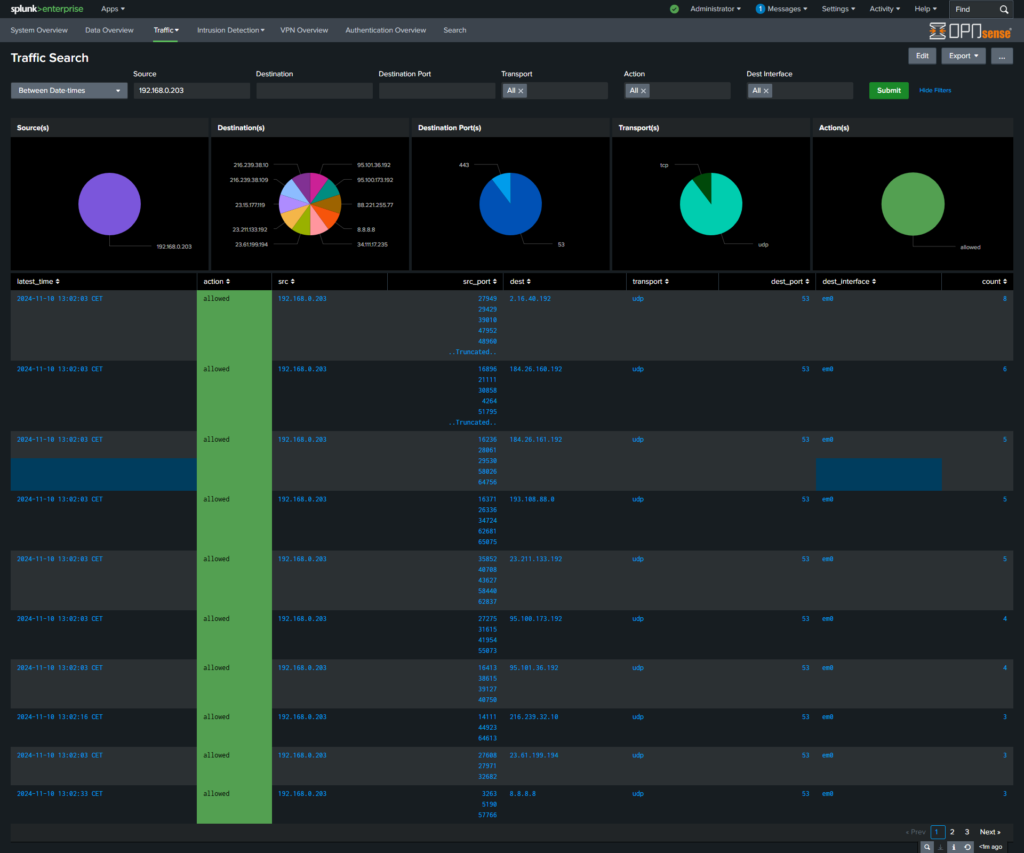
Tracking traffic from specific source address:
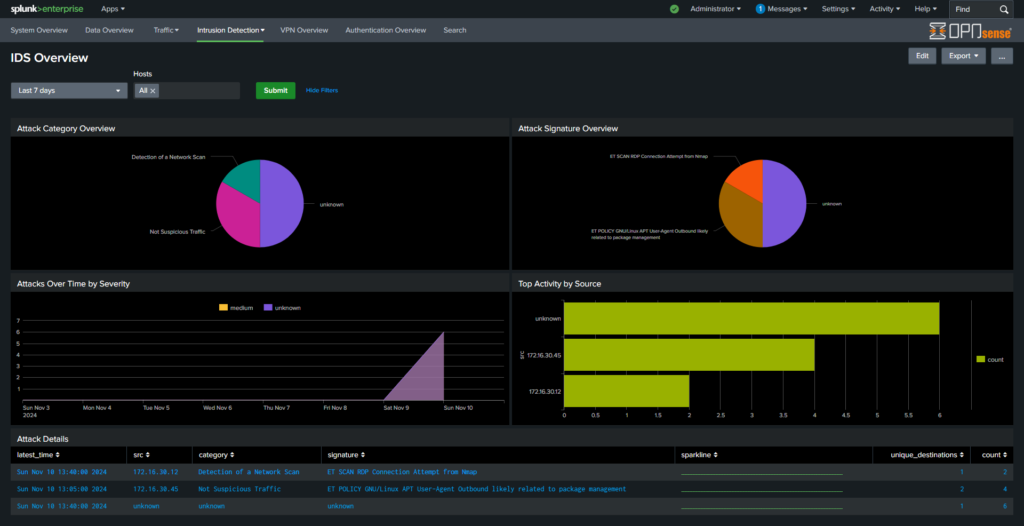
Nmap Scan Detection and Reporting:
Integrating OPNsense logs with Splunk transforms raw firewall data into actionable intelligence. This integration provides centralized visibility, strengthens network defenses, streamlines compliance, and empowers proactive security measures. For businesses, it’s a critical step toward achieving robust, data-driven security and network monitoring.


