Views: 36
SNORT in IDS/IPS mode
IDS/IPS mode with parameter “-A”
There are several alert modes available in snort;
- console: Provides fast style alerts on the console screen.
- cmg: Provides basic header details with payload in hex and text format.
- full: Full alert mode, providing all possible information about the alert.
- fast: Fast mode, shows the alert message, timestamp, source and destination ıp along with port numbers.
- none: Disabling alerting.
Only the “console” and “cmg” parameters provide alert information in the console. It is impossible to identify the difference between the rest of the alert modes via terminal. Differences can be identified by looking at generated logs.
IDS/IPS mode with parameter “-A console”
Console mode provides fast style alerts on the console screen. Start the Snort instance in console alert mode (-A console ) with the following command
sudo snort -c /etc/snort/snort.conf -A console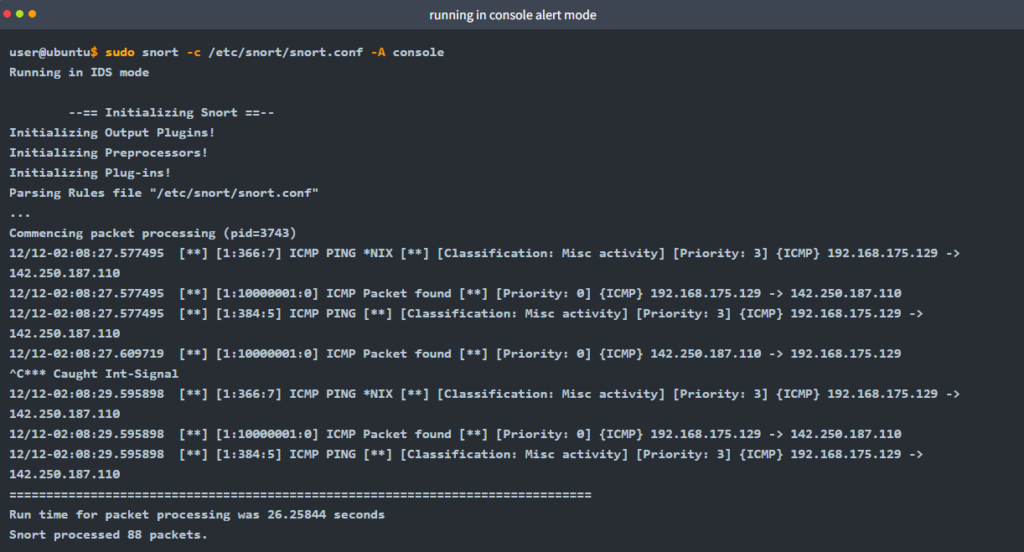
IDS/IPS mode with parameter “-A cmg”
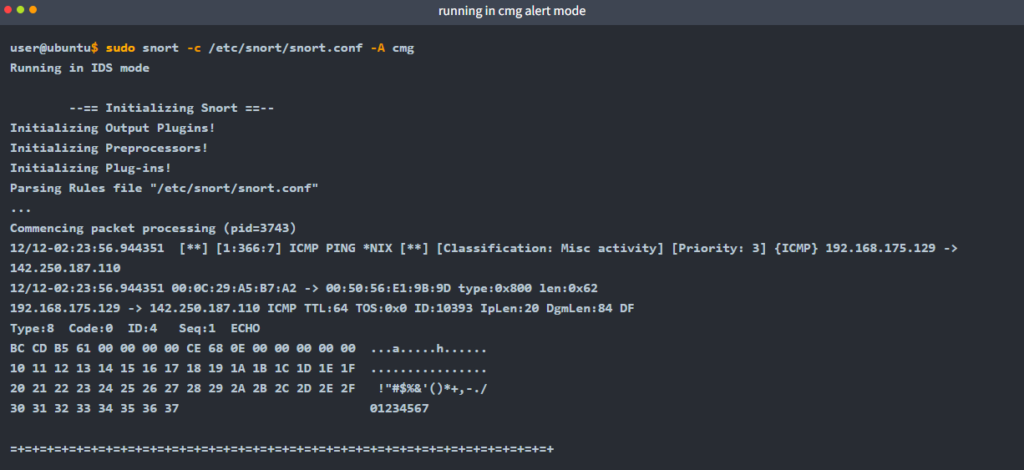
Cmg mode provides basic header details with payload in hex and text format. Start the Snort instance in cmg alert mode (-A cmg ) with the following command
sudo snort -c /etc/snort/snort.conf -A cmgOnce the traffic is generated, snort will start generating alerts according to provided ruleset defined in the configuration file.
IDS/IPS mode with parameter “-A fast”
Fast mode provides alert messages, timestamps, and source and destination IP addresses. Remember, there is no console output in this mode. Start the Snort instance in fast alert mode (-A fast ) with the following command
sudo snort -c /etc/snort/snort.conf -A fast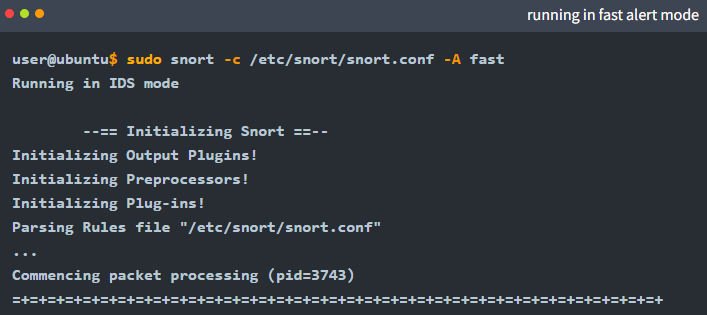

Fast style alerts contain summary information on the action like direction and alert header.
IDS/IPS mode with parameter “-A full”
Full alert mode provides all possible information about the alert. Remember, there is no console output in this mode. Start the Snort instance in full alert mode (-A full ) with the following command
sudo snort -c /etc/snort/snort.conf -A full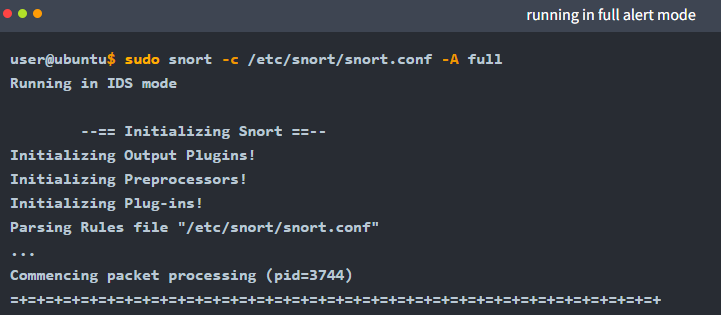
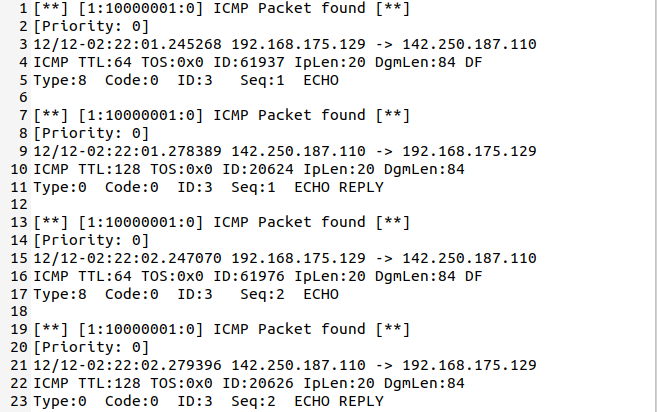
As seen in the given picture above, full style alerts contain all possible information on the action.
IDS/IPS mode with parameter “-A none”
Disable alerting. This mode doesn’t create the alert file. However, it still logs the traffic and creates a log file in binary dump format. Remember, there is no console output in this mode. Start the Snort instance in none alert mode (-A none) with the following command
sudo snort -c /etc/snort/snort.conf -A none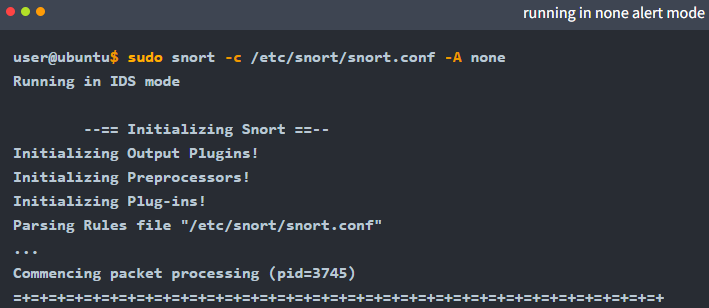
As you can see in the picture below, there is no alert file. Snort only generated the log file.

IDS/IPS mode: “Using rule file without configuration file”
It is possible to run the Snort only with rules without a configuration file. Running the Snort in this mode will help you test the user-created rules. However, this mode will provide less performance.
sudo snort -c /etc/snort/rules/local.rules -A console
IPS mode and dropping packets
Snort IPS mode activated with -Q –daq afpacket parameters. You can also activate this mode by editing snort.conf file. However, you don’t need to edit snort.conf file in the scope of this room. Review the bonus task or snort manual for further information on daq and advanced configuration settings: -Q --daq afpacket
Activate the Data Acquisition (DAQ) modules and use the afpacket module to use snort as an IPS: -i eth0:eth1
Identifying interfaces note that Snort IPS require at least two interfaces to work.
sudo snort -c /etc/snort/snort.conf -q -Q --daq afpacket -i eth0:eth1 -A console
PCAP Investigation using Snort
Capabilities of Snort are not limited to sniffing, logging and detecting/preventing the threats. PCAP read/investigate mode helps you work with pcap files. Once you have a pcap file and process it with Snort, you will receive default traffic statistics with alerts depending on your ruleset.
| Parameter | Description |
|---|---|
| -r / –pcap-single= | Read a single pcap |
| –pcap-list=”” | Read pcaps provided in command (space separated). |
| –pcap-show | Show pcap name on console during processing. |
Investigating single PCAP with parameter “-r”
For test purposes, you can still test the default reading option with pcap by using the following command
snort -r icmp-test.pcapLet’s investigate the pcap with our configuration file and see what will happen
sudo snort -c /etc/snort/snort.conf -q -r icmp-test.pcap -A console -n 10
Investigating multiple PCAPs with parameter “–pcap-list”
Let’s investigate multiple pcaps with our configuration file and see what will happen.
sudo snort -c /etc/snort/snort.conf -q --pcap-list="icmp-test.pcap http2.pcap" -A console -n 10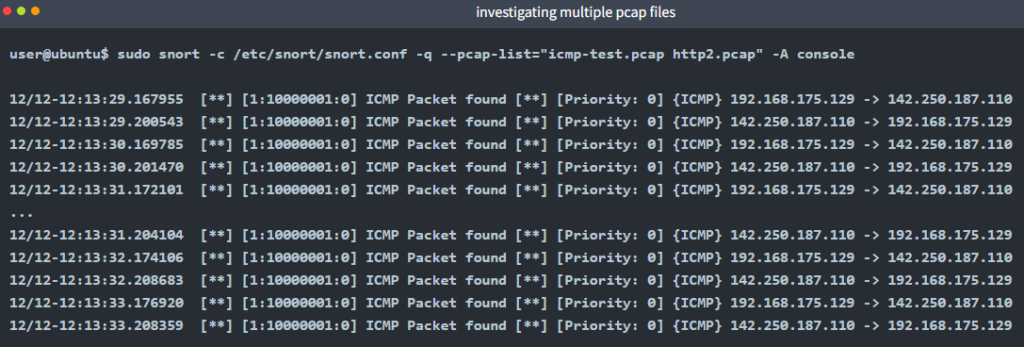
Here is one point to notice: we’ve processed two pcaps, and there are lots of alerts, so it is impossible to match the alerts with provided pcaps without snort’s help. We need to separate the pcap process to identify the source of the alerts.
Investigating multiple PCAPs with parameter “–pcap-show”
Let’s investigate multiple pcaps, distinguish each one, and see what will happen.
sudo snort -c /etc/snort/snort.conf -q --pcap-list="icmp-test.pcap http2.pcap" -A console --pcap-show
As you can see in the given output, snort identified the traffic, distinguished each pcap file and prompted the alerts according to our ruleset.
Follow this link to read PART III of the series.


