Views: 78
Splunk Search & Reporting App Overview
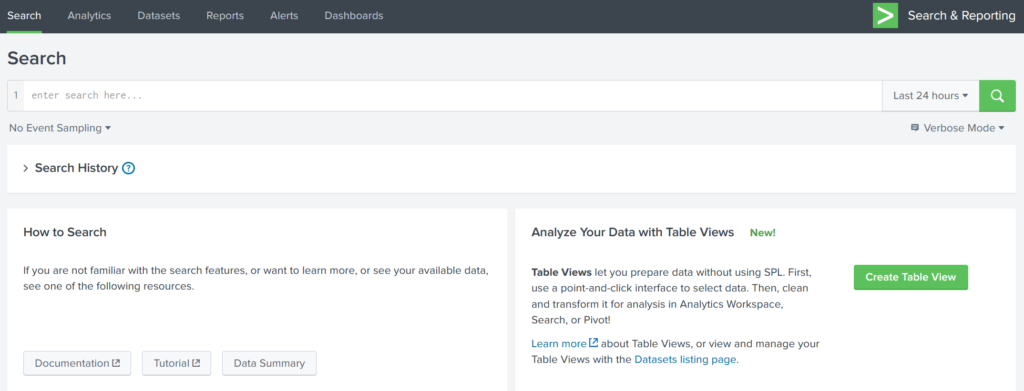
The Search & Reporting App is the primary interface on Splunk’s Home page used for searching and analyzing data. This app provides several essential functionalities to enhance the search experience for analysts.
Search & Reporting App is the default interface used to search and analyze the data on the Splunk Home page. It has various functionalities that assist analysts in improving the search experience.

Key Functionalities
1. Search Head
- Acts as the central area for executing Search Processing Language (SPL) queries to retrieve data.

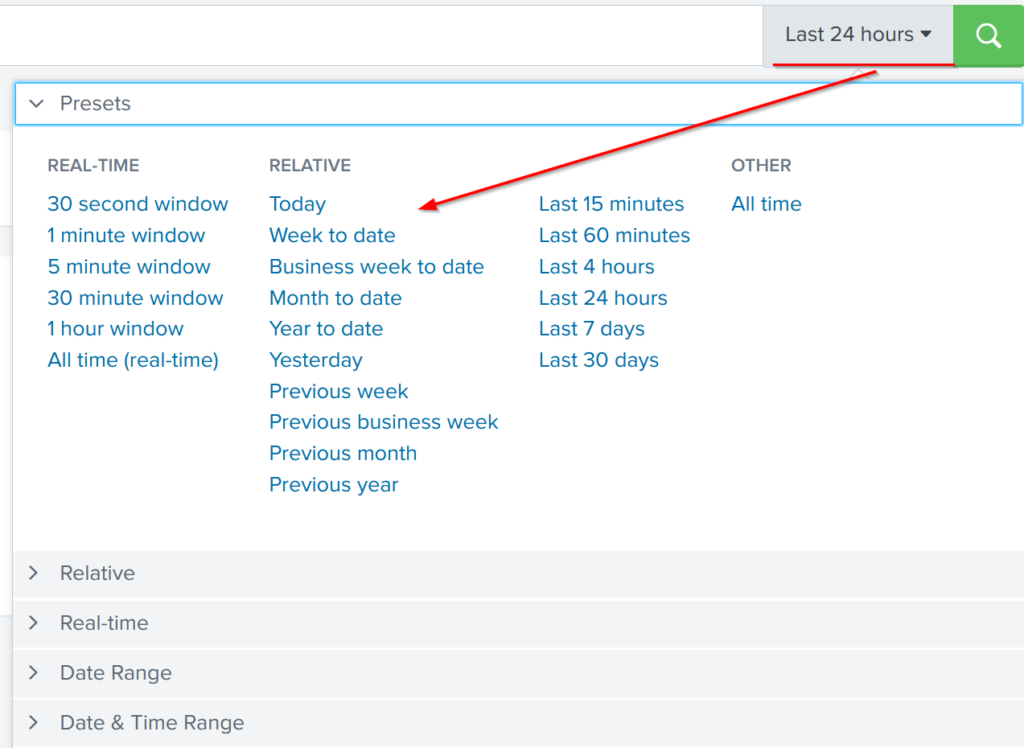
2. Time Duration
- Time Selection Options: Offers flexible time ranges (e.g., “All-time” for real-time data, “Last 60 minutes” for recent data).
- Improves search specificity by allowing users to filter data by timeframes.

3. Search History
- Saves previous search queries along with the timestamps of when they were run.
- Filter Option: Helps locate specific past queries based on terms, enhancing reusability and efficiency.

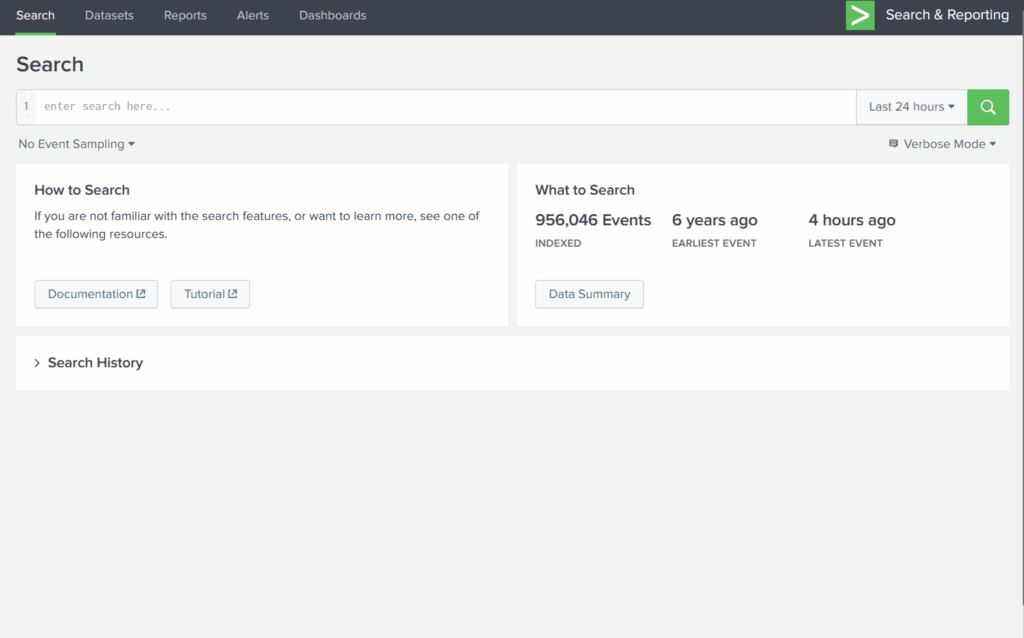
4. Data Summary
- Provides a brief overview of:
- Data Types: Types of data being processed.
- Data Sources: Origins of the events.
- Hosts: Devices or systems that generated the events.
- Crucial for achieving quick visibility into network activity and event distribution.

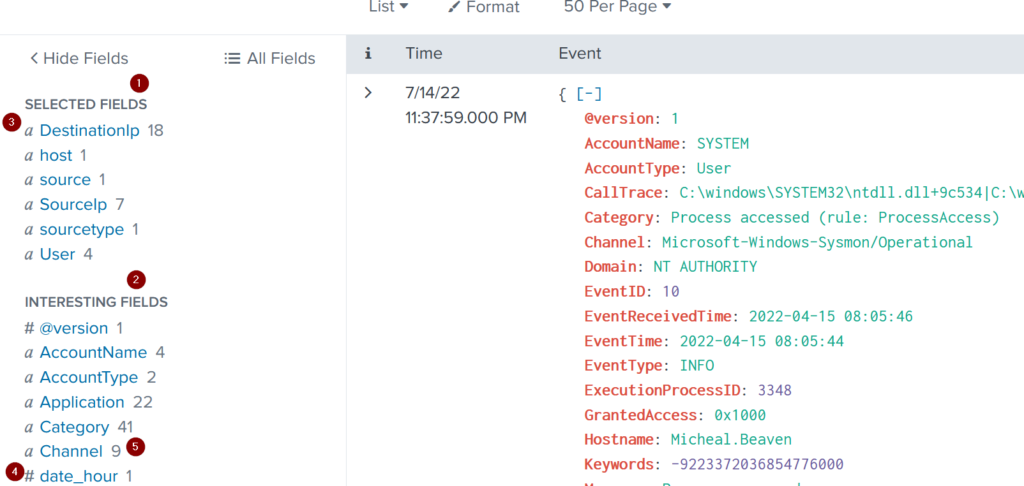
5. Field Sidebar
The Field Sidebar appears on the left panel of the Splunk search interface, divided into:
- Selected Fields: Displays essential fields such as
source,sourcetype, andhost. Analysts can add additional fields as needed. - Interesting Fields: Lists fields flagged as relevant for further investigation.

Sidebar Symbols and Indicators:
| 1- Selected Fields | Splunk extracts the default fields like source, sourcetype, and host, which appear in each event, and places them under the selected fields column. We can select other fields that seem essential and add them to the list. |
| 2- Interesting Fields | Pulls all the interesting fields it finds and displays them in the left panel to further explore. |
| 3- Alpha-numeric fields ‘α’ | This alpha symbol shows that the field contains text values. |
| 4- Numeric fields ‘#’ | This symbol shows that this field contains numerical values. |
| 5- Count | The number against each field shows the number of events captured in that timeframe. |
Based on TryHackMe Advanced Splunk module


